

Power BI’s latest feature release, Visual Calculations, represents a paradigm shift in how users interact with data.
Rolled out in February 2024 as a preview, this groundbreaking addition enables users to craft dynamic calculations directly within visuals. It opens up a new era of simplicity, flexibility and power in data analysis.
Visual Calculations are different from traditional calculation methods in Power BI. They are linked to specific visuals instead of being stored within the model. This simplifies the creation process and improves maintenance and performance. Visual Calculations allow users to generate complex calculations seamlessly, without the challenges of filter context and model intricacies.
This article explores Visual Calculations, including their types, applications, and transformative impact for Power BI users. Visual Calculations can revolutionize the data analysis landscape within Power BI by simplifying DAX complexities and enhancing data interaction.
Enable visual calculations
To enable this preview feature, navigate to Options and Settings > Options > Preview features and select Visual calculations. After restarting the tool, Visual Calculations will be enabled.
Adding a visual calculation
To add a visual calculation, select a visual and then select the New calculation button in the ribbon:
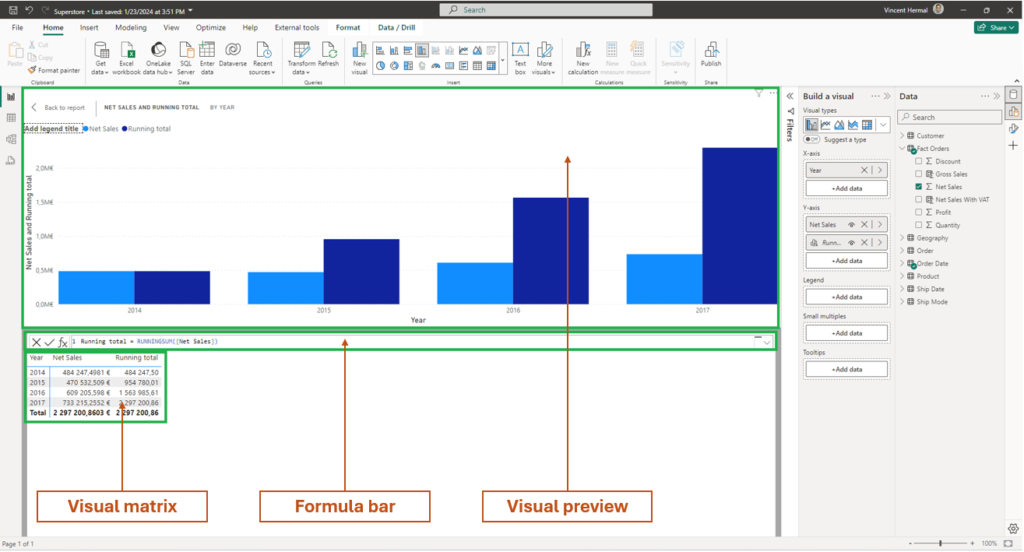
The visual calculations window becomes accessible when you enter Edit mode. Within the Edit mode interface, you’ll encounter three primary sections, arranged sequentially from top to bottom:
- The visual preview which shows the visual you’re working with
- A formula bar where you can define your visual calculation
- The visual matrix which shows the data used for the visual, and displays the results of visual calculations as you add them
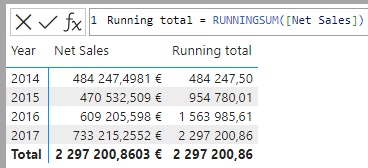
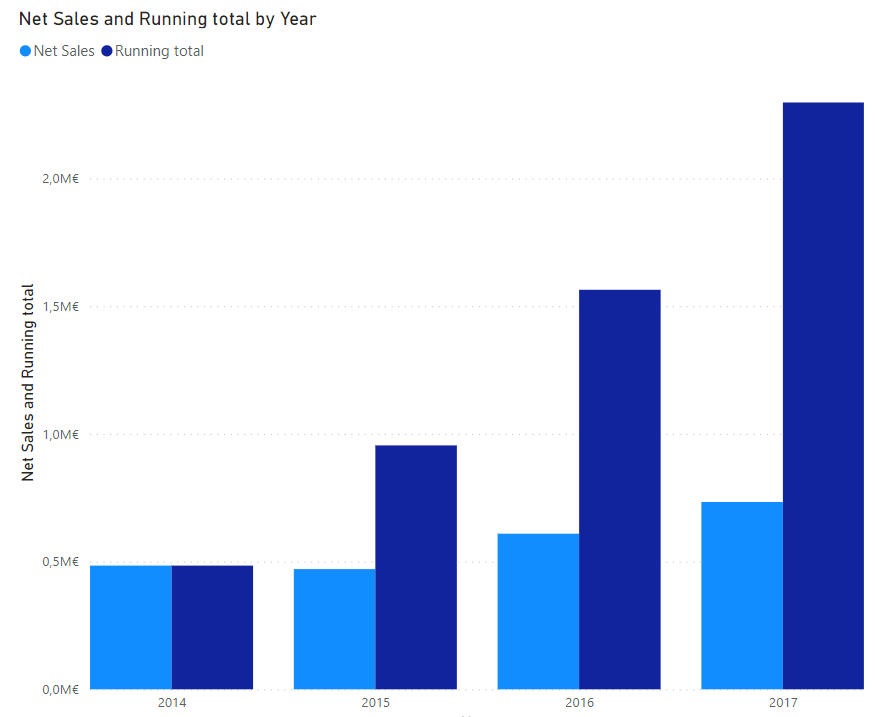
To create a visual calculation, simply input the expression into the formula bar. For instance, within a visual displaying Net Sales by Year, you can add a visual calculation to determine the running total by entering:
Running total = RUNNINGSUM([Net Sales])
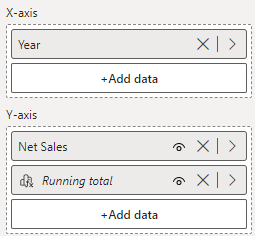
As you add visual calculations, they’re shown in the list of fields on the visual:
Additionally, the visual calculation is shown on the visual:
Without visual calculations, it’s a bit more complex: you must combine several DAX functions to get the same result. The DAX equivalent at model level would be the following formula:
Running total (model level) =
VAR MaxDate = MAX('Order Date'[Date])
RETURN
    CALCULATE(
        SUM('Fact Orders'[Net Sales]),
        'Order Date'[Date] <= MaxDate,
        ALL('Order Date')
    )
Use fields for calculations without showing them in the visual
In Edit mode for visual calculations, you can hide fields from the visual. For example, if you want to show only the running total visual calculation, you can hide Net Sales from the view:
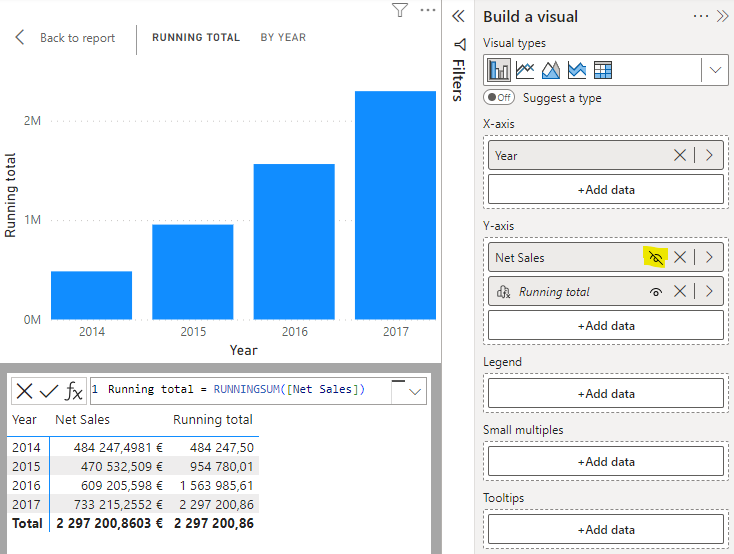
Hiding fields doesn’t remove them from the visual, so your visual calculations can still refer to them and continue to work. A hidden field will still appear in the visual matrix but will simply not appear in the resulting visual. It’s a very good idea from Microsoft, and a very practical one! As a good practice, we recommend to include hidden fields only if they are necessary for your visual calculations to work.
Templates available for common scenarios
To start with, several templates are already available, covering the most common scenarios:
- Running sum: Calculates the sum of values, adding the current value to the preceding values. Uses the RUNNINGSUM function.
- Moving average: Calculates an average of a set of values in a given window by dividing the sum of the values by the size of the window. Uses the MOVINGAVERAGE function.
- Percent of parent: Calculates the percentage of a value relative to its parent. Uses the COLLAPSE function.
- Percent of grand total: Calculates the percentage of a value relative to all values, using the COLLAPSEALL function.
- Average of children: Calculates the average value of the set of child values. Uses the EXPAND function.
- Versus previous: Compares a value to a preceding value, using the PREVIOUS function.
- Versus next: Compares a value to a subsequent value, using the NEXT function.
- Versus first: Compares a value to the first value, using the FIRST function.
- Versus last: Compares a value to the last value, using the LAST function.
Conclusion
Visual Calculations bridge the gap between calculated columns and measures, offering the simplicity of context from calculated columns and the dynamic calculation flexibility of measures. Visual Calculations offer improved performance compared to detail-level measures when operating on aggregated data within visuals. They can refer directly to visual structure, providing users with unprecedented flexibility in data analysis.
This new feature will be very useful for those who are new to Power BI and for whom the DAX language can be a real challenge. It will simplify some calculation scenarios!
Author: Vincent HERMAL, Data Analytics Practice Leader at AKABI