

Nowadays a wide number of companies understand the need to be data-oriented and to exploit the generated data to extend their successfulness.
However, some companies still have no clue of the power of data and might be frigid to invest considerable amounts of money on data management systems with no guarantee of benefits. For these companies, offering a full free open-source data management can be a nice way to demonstrate the added value of business intelligence systems. We built a complete open-source free data management system and we’re going to show you how easy it can be.
Data Integration
First-of-all, we use Talend Open Studio for Data Integration(TOS) as our ETL to gather data from different sources (databases, API, flat files, …) and to integrate these data into our Datawarehouse.
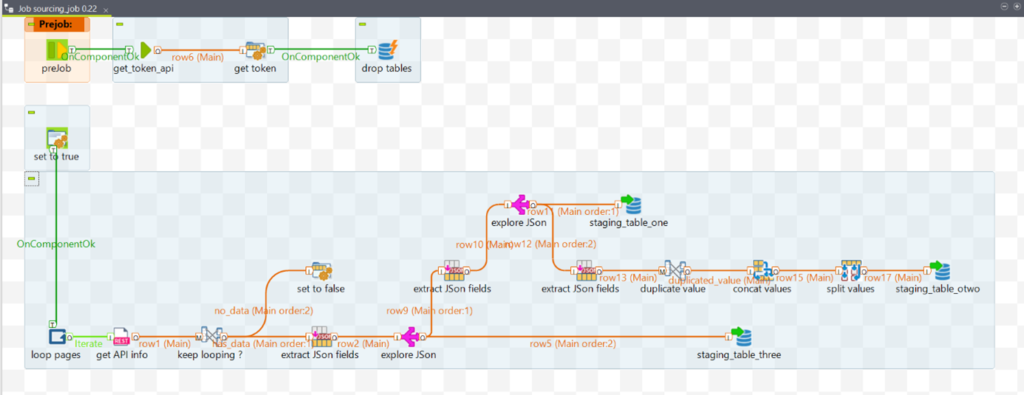
Figure 1: Example of sourcing job
TOS is used both to get data and to integrate it into Datamarts. The sourcing and storing flows are distinct and executed independently. To improve support, every part of the process can be executed alone.
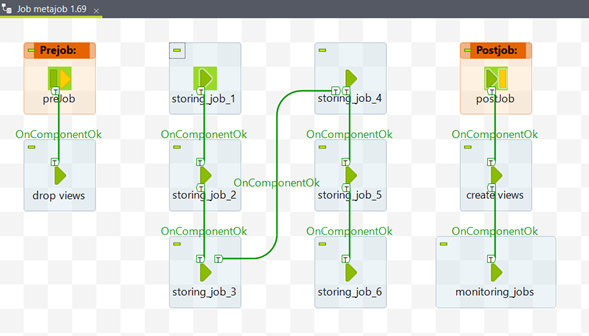
Figure 2: example of storing metajob
Database
A database is necessary to store all the data produced by the data gathering and integration processes built in Talend jobs. We chose PostgreSQL database. This choice was driven by its high application-suitability because Pentaho’s repository database can be a PostgreSQL DB as well as for its extended SQL language.
Collaboration
As the BI solution put in place grows day after day, the BI team working on this solution is also growing day after day. To be able to work together on the same solution, we need to have a collaboration tool that allows us to save works on a shared repository. The tool we’re using is GIT. GIT allows us to save multiple types of files, from documentation to ETL jobs, including Reports definition file so that we’re always working on the latest versions of each file without having to ask questions every time to the team.
Orchestration
It’s important to have jobs able to gather/treat information and meta-jobs to combine them. It’s also important to have a way to schedule these meta-jobs, in the right order, on a certain frequency. This is called Orchestration and the tool we use is GoCD.
GoCD allows us to schedule our meta-jobs, built from Talend, at a certain time of the day.
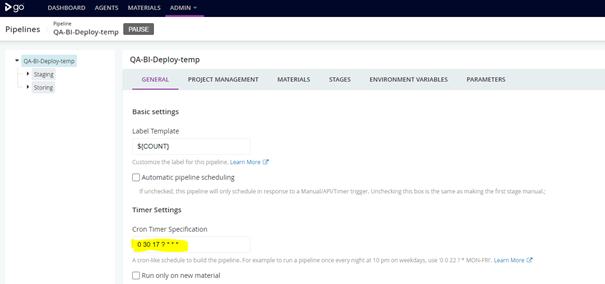
Figure 3: defining the scheduling
Basically, GoCD is used thanks to Pipelines. One Pipeline is composed of several Stages that are executed one after the other.
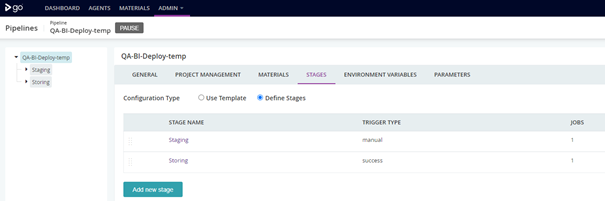
Figure 4: list of stages
Our Pipeline is linked to a specific GIT repository and each stage take a specific job, inside this GIT repository, based on several variables beforehand defined and execute it in a specific environment.
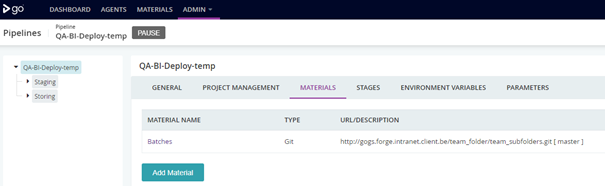
Figure 5: link to GIT repository
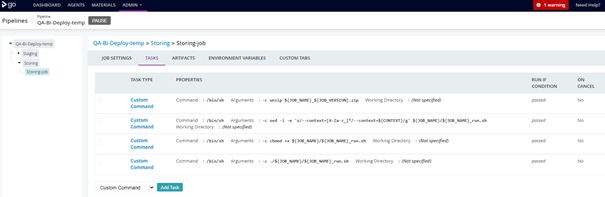
Figure 6: tasks’s content
Figure 7: stages’s variables
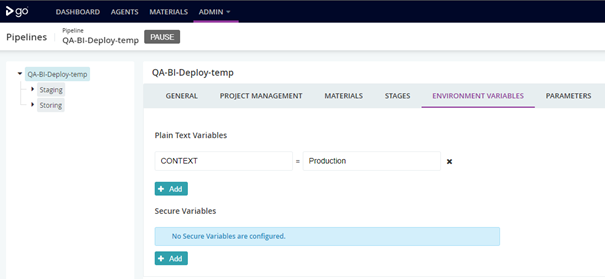
Figure 8: pipeline’s variables
Exploitation
Finally, we exploit our data using some of Hitachi Vantara’s Pentaho solutions. Basic reports are built using Pentaho report designer (PRD), which is a so-called “What You See, What You Get” tool. These reports data is built using custom SQL queries as data sources for example.
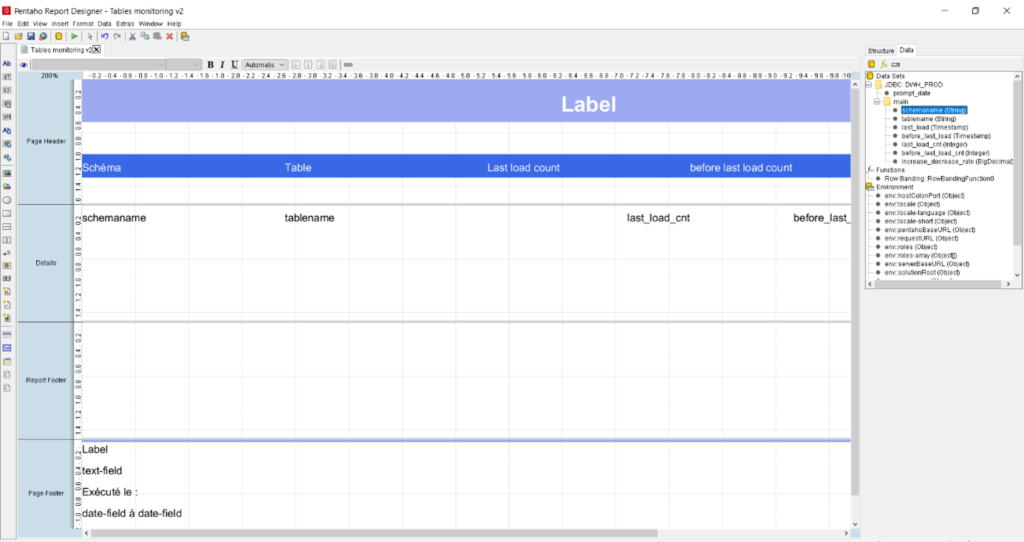
Figure 9: PRD user interface
The reports can then be generated from Pentaho User Console (which manages users and reports) or scheduled on a fixed time basis and sent by email.
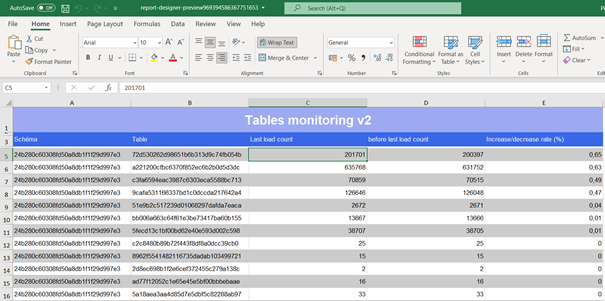
Figure 10: example of report
We also use Pentaho Community Dashboard Editor (CDE) to create dashboards. These dashboards can be accessed using Pentaho User Console or can be web integrated.
The last Pentaho solution we use is Mondrian. It helps us to create multidimensional cubes. Those cubes can thereafter act as data sources for CDE Dashboards or PRD Reports or Excel sheets for instance.
Conclusion
In conclusion, to build a free BI Solution Architecture, we used the following stack:
- Open Studio for Data Integration
- PostgreSQL Database
- GIT Versioning
- Go Continuous Delivery
- Pentaho Report Designer
- Pentaho Community Dashboard Editor