Power BI and QlikView Comparison

September 28, 2022

Business Inteligence

Read in minutes

When we talk about Business Intelligence and Data Visualization, there are 3 leaders on the market today; Power BI, Qlik (Qlikview & Qliksense) and Tableau. 

Power BI was developed by Microsoft in 2010 as the Crescent Project. The first version was released in 2011. Later, Microsoft gave it the name of Power BI and it will be released in 2015. Today Power BI emerges as a leader of Business Intelligence tools in the market. 

Qlikview was first called Quikview in 1994 (long before Microsoft) but was renamed in 1996. When QlikView was created, its main function was to collect in-depth analysis of data from different systems. Finally, it evolved into Business Intelligence software where it now enjoys top marks from several software review sites.

In this article, we provide an overall comparison, through different criteria, between Power BI and QliKview, based on feedback (migrations from QlikView to Power BI for example) and documentation.

Data Sources

Regarding connectivity, two softwares allow extensive access to different types of data, whether located on-premise or in the cloud. However, QlikView has the particularity of requiring the prior downloading and installation of these connectors before being able to use them. Overall, in both cases, connecting to data sources is not a major problem.

Filter, Slicer and Selection

One of QlikView’s strengths is certainly its associative experience and its filter management. We are able to make a selection and a filter directly using a simple click on the values available through all the visuals. In this case we talk about Cross Filtering, it means all the visuals adapt to the interaction that we have with another visual.

This feature is also available in Power BI but unfortunately it only works on one tab. If we want to persist our selection through tabs, we have to use slicers and we need to synchronize them. For QlikView users, this intermediate step can be less intuitive and more costly in terms of navigation.

Unlike query-based BI tools, using in-memory associative technology, when QlikView users select a data point, no query is triggered. But all other fields are instantly filtered and grouped based on the user’s selection. Selection appear in green and datasets which are related to the selection appear in white. Data which is unrelated to the selection appear in gray. With this way, users have access to a tool which is both intuitive and user-friendly to browse data and to search information related to their activities.

On the other hand, Power BI does not directly allow to display data which is not linked to our selection.

Data Processing and Transformation 

Features to process and transform data in both software are numerous but those of Qlikview, thanks to a scripting language, are considered advanced and offer more possibilities during development. But the level of required knowledge is higher to master QlikView language and to provides our first models.

On the other hand, with its intuitive interface, Power BI is easy to use for less experienced people and especially those who do not have programming skills.

User Interface

Power BI is very intuitive with Drag & Drop everywhere. A novice user is able to create visuals and dashboards very easily.

For its part, QlikView allows a more advanced level of customization than Power BI but is much less intuitive and more complex, especially for a new user.
 
But if the investment is made to master and to use the full potential of QlikView, its highly customizable setup and his wide range of features can be a key advantage.

Price 

Power BI pricing is simple. The desktop version is free, while Power BI Pro costs less than $10 per user per month. The latest version – Power BI Premium – offers capacity pricing that helps to optimize costs.

For QlikView, fees are not so simple. QlikView website offers two editions, Enterprise and Personal. While the personal version, to use on a personal computer, is free, the price of the enterprise version is only accessible after contacting their sales team. According to anecdotal experience, no solution can beat the cost effectiveness of Power BI and QlikView is estimated to be 2-3 times more expensive.

Conclusion

In conclusion, Power BI and QlikView are two colossus of data processing and visualization. In most cases, these two softwares will fulfill all features in terms of data exploration and analysis.

However, Qlikview appears to be more complex and requires a higher level of learning but offers more customization advantages.
Indeed Power BI spotlight an easy-to-use and a familiar interface for users who know Microsoft environment. It is updated really often unlike QlikView, with the addition of many interesting features to its catalog. We need to take also its community into consideration since it is very active and it can be a very interesting support.

In addition, its acquisition turns out to be much less expensive than Qlikview, an important argument for companies today. It is certainly for these reasons that we find Microsoft as the leader of BI market and ahead of QlikView.
However Qlik does not give up, and has spotlighted last years his new flagship product Qliksense, which seems to adopt the many qualities of Power BI.

SHARE ON :


Related articles

March 25, 2024

Read in minutes

Getting started with the new Power BI Visual Calculations feature!

Power BI’s latest feature release, Visual Calculations, represents a paradigm shift in how users interact with data.      Rolled ...

February 20, 2024

Read in 5 minutes

Revolutionizing Data Engineering: The Power of Databricks’ Delta Live Tables and Unity Catalog

Databricks has emerged as a pivotal platform in the data engineering landscape, offering a comprehensive suite of tools designed to tackle the complexities of d...

November 20, 2023

Read in 5 minutes

AKABI’s Consultants Share Insights from Dataminds Connect 2023

Dataminds Connect 2023, a two-day event taking place in the charming city of Mechelen, Belgium, has proven to be a cornerstone in the world of IT and Microsoft ...


comments

Blazor – Telerik UI Components

September 16, 2022

Software Development

Read in minutes

The Blazor framework by Microsoft allows you to create rich web UIs by using .NET and C#. The Telerik® UI for Blazor components facilitate the front-end development by providing ready-made UI components.

Gather information and code snippets to help you develop, test and publish your applications:

Documentation

Here is some summary of all useful information and code snippets to help develop, test and publish your applications:

1.   Product Documentation: The Telerik UI for Blazor documentation hub includes detailed information about each control, theme, tag helpers and more.

2.   Virtual Classroom: This on-demand and hands-on training program will help you hit the ground running with Telerik UI for Blazor. You’ll learn valuable skills while building a sample application in easy-to-digest modules. The Virtual Classroom is only available to trial and licensed users, so take advantage today.

3.   Theme Builder: Easily customize the predefined themes or build a new one based on your business need using Telerik SAAS Theme Builder.

4.   Video Tutorials: A hands-on tutorial of working with Blazor with the help of Telerik UI for Blazor, delivered by a true pro: Ed Charbeneau, three-time Microsoft MVP.

5.   Knowledge Base: The place to find answers to frequently and not-so-frequently asked questions

6.   Product Support:

o    Looking for an answer on specific technical topic – visit the Telerik UI for Blazor support forums.

o    Need some help – 30-day trial also comes with unlimited outstanding technical support delivered by the team that build the components. Just go to our customer support page and file a ticket. Not sure how to file a ticket – blog on that

8.   Social Media:  Facebook or Twitter to stay up to date on the latest developments.

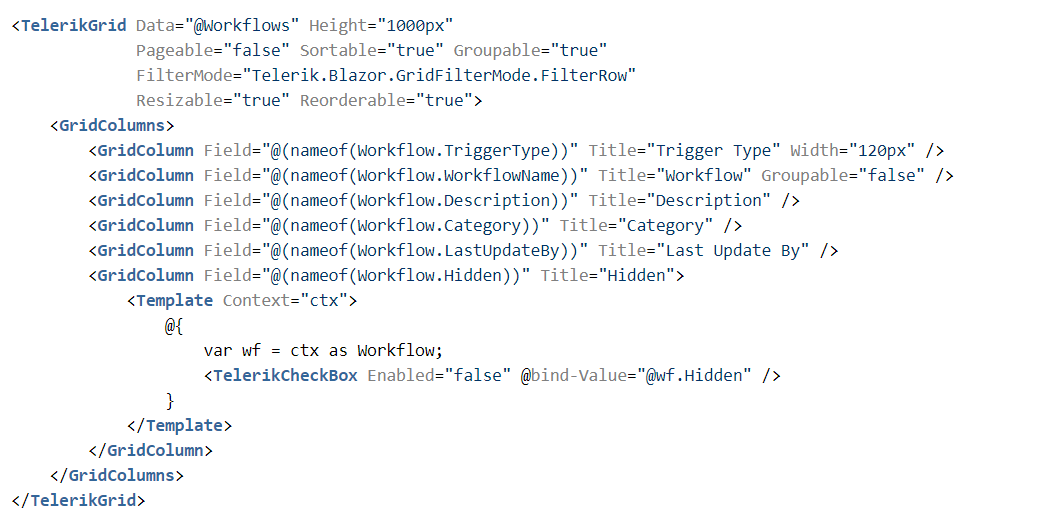
Example: checkbox in grid via a template

SHARE ON :


Related articles

March 25, 2024

Read in 4 minutes

Coding Camp Python

Continuous learning is part of AKABI’s DNA. Every year, all the collaborators have the opportunity to register for some training. At the start of the year...


comments

PowerBI CICD with Azure DevOps (Setting up the tenant) (2/3)

September 15, 2022

Business Inteligence

Read in minutes

Previous post Introduction & Implementation

Now, we need to enable the service to use PowerBI API

  1. Go to Settings
  2. Click to Admin portal
  3. Go for Tenant settings
  4. Then in the Developer settings part Allow service principal to use PowerBI API
Figure 5 Setting up tenant

Grant access to workspace

Now, we need to add the service as admin to the workspace

  1. Go to Workspace
  2. Click on the three dots and Workspace access
  3. Add the PowerBI service connection and give him Admin role
  4. Finally click on Add
Figure 6 Grant access to workspace

Adding the service as gateway owner

To be able to use the tenant create in the Azure Active Directory we need to add the service as owner of the gateway

Add the extension to Azure DevOps

As we explain before, this work is based on an extension. We need to add it to Azure DevOps.

  1. On the top right corner click on the and then Browse marketplace
  2. Search for PowerBI actions
  3. Click on Get it free
  4. Select your organization and download the extension

Creation of the service connection in Azure DevOps

To be able to use the tenant created in the Azure Active Directory we need to create a service connection in Azure DevOps

  1. Go for your organization settings and click on Service Connection
  2. Create a service connection by searching Power BI Service Connection
  3. Select Service Principal and then fill Tenant ID and Client ID with the credentials that you copied beforehand. If not, you can find it in the Azure Active Directory under the app registration menu
Figure 7 Add service connections

Now that we have set up every tool, we can create the release pipeline.

SHARE ON :


Related articles

March 25, 2024

Read in minutes

Getting started with the new Power BI Visual Calculations feature!

Power BI’s latest feature release, Visual Calculations, represents a paradigm shift in how users interact with data.      Rolled ...

February 20, 2024

Read in 5 minutes

Revolutionizing Data Engineering: The Power of Databricks’ Delta Live Tables and Unity Catalog

Databricks has emerged as a pivotal platform in the data engineering landscape, offering a comprehensive suite of tools designed to tackle the complexities of d...

November 20, 2023

Read in 5 minutes

AKABI’s Consultants Share Insights from Dataminds Connect 2023

Dataminds Connect 2023, a two-day event taking place in the charming city of Mechelen, Belgium, has proven to be a cornerstone in the world of IT and Microsoft ...


comments

PowerBI CICD with Azure DevOps (Introduction & Implementation) (1/3)

September 14, 2022

Business Inteligence

Read in minutes

Introduction

The purpose of this document is to explain how to implement PowerBI CICD in Azure DevOps. This document is for those who are tired of publishing reports by hand on different environments.

To implement the solution, we used the “Power BI actions” extension which you can find here.

This document will walk you through the steps we took to implement the solution.

The extension

The PowerBI Actions extension is based on the PowerBI API created by Microsoft that you can find here. The extension allows you to automate several tasks such as Upload / Import a PowerBI dashboard, create a workspace, update a report connection…To perform these tasks, the extension must work with a connection to the PowerBI service connection.

Implementation

To perform the following steps, you must have sufficient authorization. If you do not have sufficient authorization, you may need to contact someone who does.

Creation of the PowerBI service connection

  1. Sign in to Azure Portal
  2. Select Azure Active Directory and then App Registration
  3. Click on New Registration
Figure 1 Creation of PowerBI service connection first step
Figure 2 Creation of PowerBI service connection second step

On the next page, copy the application IDs for further use.

Then we need to create a client secret:

  1. Go to certificates & secrets
  2. Click on New client secret
  3. Add a description
  4. Click on Add
Figure 3 Creation of client secrets

Now, we need to give some permission to the app

  1. Go to App permission
  2. Click to Add permission
  3. Go for PowerBI Service
  4. Select Application permissions
  5. Check Tenant.Read.All and Tenant.ReadWrite.All
  6. Click on Add Permission
Figure 4 Add permissions

Now the app as been created and it’s ready to be used in PowerBI

SHARE ON :


Related articles

March 25, 2024

Read in minutes

Getting started with the new Power BI Visual Calculations feature!

Power BI’s latest feature release, Visual Calculations, represents a paradigm shift in how users interact with data.      Rolled ...

February 20, 2024

Read in 5 minutes

Revolutionizing Data Engineering: The Power of Databricks’ Delta Live Tables and Unity Catalog

Databricks has emerged as a pivotal platform in the data engineering landscape, offering a comprehensive suite of tools designed to tackle the complexities of d...

November 20, 2023

Read in 5 minutes

AKABI’s Consultants Share Insights from Dataminds Connect 2023

Dataminds Connect 2023, a two-day event taking place in the charming city of Mechelen, Belgium, has proven to be a cornerstone in the world of IT and Microsoft ...


comments

PowerBI CICD with Azure DevOps (Creation of the release pipeline) (3/3)

September 14, 2022

Business Inteligence

Read in minutes

Previous post Setting up the tenant

For this part, we assume that you already have a pipeline for power BI. Moreover, the solution presented here fit our project, it may be that you need to add or modify some steps.

Deployment in DEV

Firstly, we need to add the Power BI Action task.

  1. Click on the + sign
  2. Search for Power BI Actions
  3. Add the task
Figure 8 Add a task
  1. Add the service connection
  2. Select the action Upload Power BI Report
  3. Add the name of the workspace
  4. Give the path of the folder where your reports are stored. Be careful, your report name can not contain a dot.
  5. Check Overwrite Power BI File
Figure 9 Power BI Action: Publish

Deployment in UAT

For deploying reports in UAT we use the same system, but we must add more steps because reports are published with the DEV dataset. We must therefore change it to the associated dataset.

The first task is another Power BI Action: Publish   the configuration is identical as the one for DEV, we just change the Workspace name to UAT.

The second task give the ownership of all datasets to the service connection.

  1. Selection the task Take dataset ownership
  2. Add the name of the workspace
  3. Check Update all datasets in workspace the dataset name will be ignored
Figure 10 Power BI Action: Take ownership

Then, we need to update the gateway.

  1. Selection the task Update gateway
  2. Add the name of the workspace
  3. Fill in the name of your dataset and of the getaway. We cannot check the Update all  option because the metrics report will make the job fail
Figure 11 Power BI Action: UpdateGateway

Then, we need to update the datasource.

  1. Selection the task Update datasource connection
  2. Fill in the name of the dataset
  3. Choose the Datasource type
  4. Fill the information with the one that’s fit your project
Then, we need to update the datasource.

Figure 13 Power BI Action: UpdateDatasource

The last two task must be replicate for all you report since we can’t use the Update all option.

Deployment in PROD

This part is the same as the UAT one, we just needed to change the name of the workspace and the name of the new database everywhere they appear in different steps.

Report development

Now, when you develop a report make sure to push it to your repository with the Data source settings setup with the DEV data source

SHARE ON :


Related articles

March 25, 2024

Read in minutes

Getting started with the new Power BI Visual Calculations feature!

Power BI’s latest feature release, Visual Calculations, represents a paradigm shift in how users interact with data.      Rolled ...

February 20, 2024

Read in 5 minutes

Revolutionizing Data Engineering: The Power of Databricks’ Delta Live Tables and Unity Catalog

Databricks has emerged as a pivotal platform in the data engineering landscape, offering a comprehensive suite of tools designed to tackle the complexities of d...

November 20, 2023

Read in 5 minutes

AKABI’s Consultants Share Insights from Dataminds Connect 2023

Dataminds Connect 2023, a two-day event taking place in the charming city of Mechelen, Belgium, has proven to be a cornerstone in the world of IT and Microsoft ...


comments