From Code Critic to Craftsman

July 1, 2024

Software Development

Read in minutes

My journey

Throughout my IT career, a relentless pursuit of software quality has been my guiding principle. Early in my career design patterns, those reusable solutions to common programming challenges, became my initial toolkit for building robust and well-structured code.

As my skills matured, I expanded my focus to architectural patterns – the bigger picture of software design.

This shift allowed me to consider the overall structure and organization of an application, ensuring its scalability and maintainability.

Throughout my journey, code reviews played a crucial role in sharpening my skills.

These collaborative sessions offered insights into diverse approaches, best practices, and sometimes, not-so-great practices. It was a constant feedback loop, improving my own coding abilities.

This naturally led me to pay it forward. When I write code, I strive to share the knowledge I’ve gained. Clean, well-designed code became not just a personal preference, but a commitment to quality. And code review became the channel to spread it through the collaborators.

For a while, I felt alone in my meticulous approach. But then I discovered the software craftsmanship. A whole community dedicated to the same principles I held dear: a focus on quality, continuous learning, and a deep respect for the craft of coding.

Software craftsmanship isn’t just about writing clean code; it’s about a mindset. It’s about taking pride in your work, constantly seeking improvement, and sharing your knowledge to elevate the entire profession. It’s about being not just a coder, but a true craftsman.

My favorite toy 🧸

While going deeper into software craftsmanship concepts is a worthy pursuit, I prefer to share my favorite tool within my arsenal: the hexagonal architecture.

A good way to visualize this architecture is to imagine a hexagon. Inside it sits your application’s core, focused purely on business logic. Outside the hexagon are all the external things your app interacts with, like databases, other services and UIs. The core doesn’t talk directly to these. Instead, it communicates through defined ports, like an interface contract. Specific adapters implement these ports, handling the details of talking to the specific technology. This keeps the core clean and adaptable, as you can swap out adapters for different technologies without changing the core itself.

The beauty of the hexagonal architecture lies in its simplicity. It promotes a clear separation of concerns within the codebase, reflected in a well-organized folder structure. This immediately creates an environment of readability and maintainability.

Furthermore, by isolating the core domain logic from external dependencies (represented by ports and adapters), the hexagonal architecture naturally introduces key concepts of Domain-Driven Design (DDD). This focus on the domain encourages collaboration – forcing product owners, analysts, and developers to have a shared understanding of the core business functionalities. This establishes a unified language, fostering smoother collaboration across teams.

The defined ports and adapters also serve as excellent entry points for writing clean and testable code. Coupled with dependency injection (a highly recommended practice), hexagonal architecture makes testing effortless.

Finally, the modular nature of adapters empowers you to adapt to future changes. Technological advancements or evolving business needs won’t be postponed by legacy code. Legacy code, in this context, doesn’t mean bad choices, but rather decisions made within that specific previous context. The hexagonal architecture allows you to gracefully evolve the application without being shackled by the past since the core of the application will not be impacted by new implementations of a port.

Fun fact: Even before discovering this formal pattern, I found myself instinctively trying to achieve a similar separation. I’d naturally isolate my domain logic from input concerns like API validation and output concerns like database access. While my homebrew approach wasn’t as elegant as the official hexagonal architecture, it demonstrates the power of prioritizing quality. Having the right tools is important in this changing world.

Sharing our craft for the apprentices

The world of software craftsmanship extends far beyond just writing clean code. It’s about fostering a vibrant community, a modern-day guild where experienced developers take on the role of mentors, passing their knowledge on to the next generation. Throughout my career, I’ve amassed a wealth of experience that not only benefits our clients but also holds immense value for my fellow developers.

In today’s customer-centric world, it’s easy to solely focus on the end product. However, I believe creating software that we can all be proud of, offers a significant short-term benefit for developers themselves. When we prioritize craftsmanship, we elevate the overall quality of the codebase, making it more maintainable, readable, and ultimately more enjoyable to work with. This translates directly into increased developer motivation and happiness – a win for both the individual and the long-term success of the product.

Sharing knowledge and fostering a culture of craftsmanship is what truly excites me. In my next post, I’ll delve into the various collaborative sessions I’ve found effective. If you’re interested in learning how to spread knowledge within your team, stay tuned!

Author: Simon OLBREGTS, Software Craftsmanship Practice Leader at AKABI

SHARE ON :


Related articles

March 25, 2024

Read in 4 minutes

Coding Camp Python

Continuous learning is part of AKABI’s DNA. Every year, all the collaborators have the opportunity to register for some training. At the start of the year...

September 16, 2022

Read in minutes

Blazor – Telerik UI Components

The Blazor framework by Microsoft allows you to create rich web UIs by using .NET and C#. The Telerik® UI for Blazor components facilitate the front-...


comments

Insights from the Gartner Data & Analytics Summit in London

May 28, 2024

Analytics Data Integration Event

Read in minutes

I had the opportunity of attending the Gartner Data & Analytics Summit in London from May 13th to 15th. This three-day event featured over 100 sessions, many of which ran concurrently, making it impossible to capture everything. However, I would like to share my top takeaways from this insightful conference.

D&A generate value

It’s usually very difficult to evaluate the return of the governance and management of the D&A. Gartner made a lot of studies and polls to bring some concrete evidence.

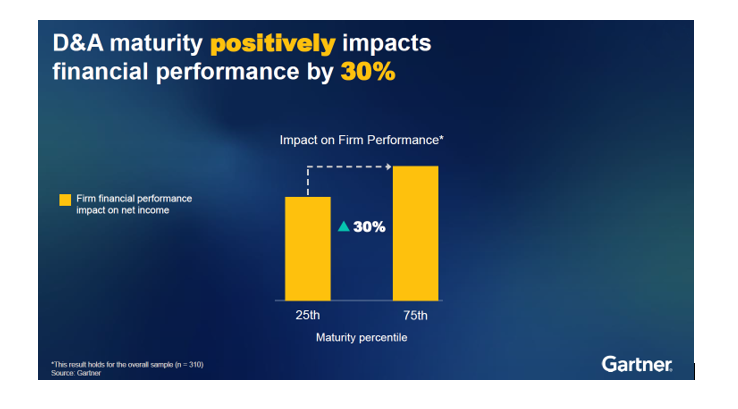
Studies show a good D&A maturity impact positively the financial performance of firms by 30%.

Governance is a keystone of D&A maturity, but its return is highly under valuated.

Firms should focus on business outcomes rather than ROI and prioritize Execution over strategy.

Evaluating the return on governance and management of Data & Analytics (D&A) is often challenging. Recent studies and polls conducted by Gartner provide some evidence to help our efforts.

A a strong D&A maturity can boost a firm’s financial performance by 30%.

Governance is a critical cornerstone of this D&A maturity, yet its value is frequently underestimated. To harness the full potential of our D&A initiatives, it’s essential that we shift our focus from traditional ROI metrics to broader business outcomes.

Moreover, prioritizing execution over strategy can drive more tangible results. By emphasizing practical implementation and operational excellence, we can ensure that our D&A governance delivers maximum value to the organization.

AI and GenAI – the elephant in the room

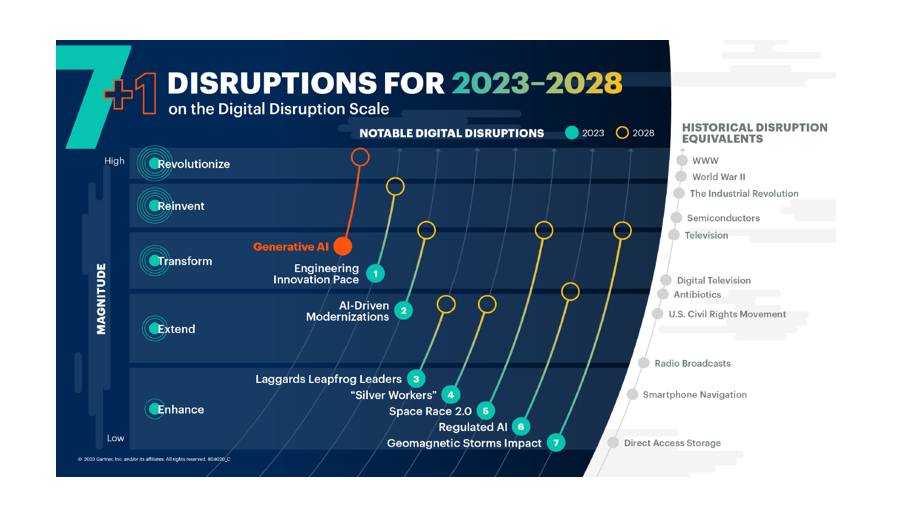
Everyone is talking about AI and GenAI, and it’s widely accepted that GenAI represents a disruption on par with the creation of the internet itself. The pressing question is: how can we harness this disruption to meet our own needs?

Studies show that firms which have designated AI as a strategic priority have outperformed their peers by 80% over the past nine years. This highlights the transformative potential of AI when integrated into a company’s core strategy.

I could hear on many sessions the “AI-ready Data” concept. Mainly compared with Analytics data, above quality, compliance, and accessibility, AI require more metadata, context, labeling. This can only be achieved through mature governance practices.

Learning & collective intelligence

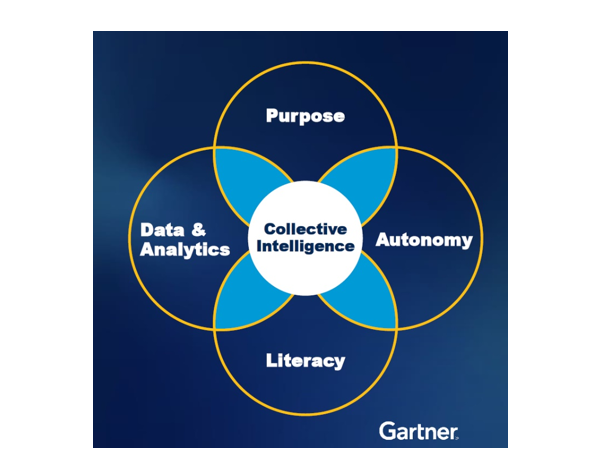
In today’s fast-paced and data-rich environment, strong centralized models struggle to keep up with the volume of data and the speed at which decisions need to be made. The concept of collective intelligence: distributing decision-making power to local groups rather than centralizing it with top management.

This approach can be effectively implemented by focusing on several key areas:

Access to the Right Data: Ensure that all team members have access to the relevant and necessary data. This empowers local groups to make informed decisions quickly and accurately.

Sense of Purpose: Clearly communicate the organization’s vision and goals. When teams understand the bigger picture and their role within it, they are more motivated and aligned with the company’s objectives.

Autonomy: Granting teams the autonomy to make decisions fosters innovation and responsiveness. Local groups are often closer to the issues at hand and can act more swiftly than a centralized authority.

Literacy: Invest in training programs that enhance data and AI literacy skills. Equipping teams with the knowledge to understand and leverage data effectively is crucial for informed decision-making.

Data Fabric and Data Mesh

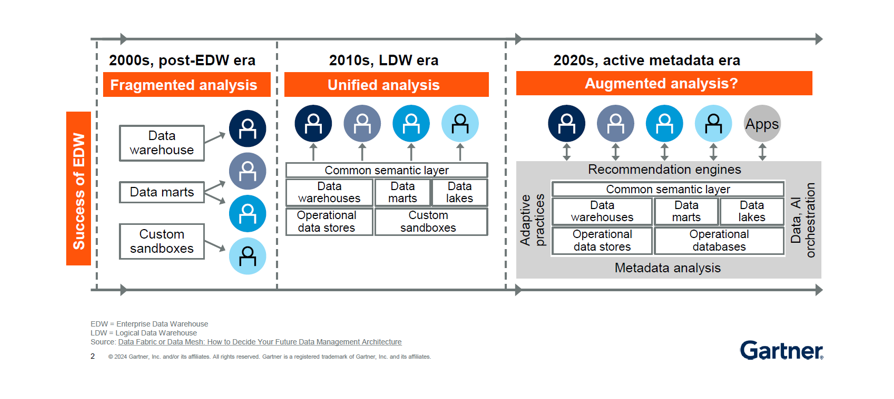
During the summit, two key architectural approaches were frequently discussed: Data Fabric and Data Mesh. While sometimes viewed as opposing strategies, they can also be seen as complementary.

Data Fabric focuses on leveraging the extended metadata provided by our existing platforms. Its primary goal is to “activate” this metadata to facilitate automated enhancements and suggestions.

Data Mesh, on the other hand, decentralizes data delivery and empowers business-driven D&A initiatives. Its core principles include treating Data as a Product.

Combining these approaches can lead to a scalable, flexible data architecture.

Data Fabric’s automation capabilities can enhance the efficiency of decentralized data management within a Data Mesh framework.

The extended metadata in Data Fabric can support the productization efforts of Data Mesh, ensuring that data products are enriched with comprehensive metadata.

Data and Analytics Governance Is Key to Your Success

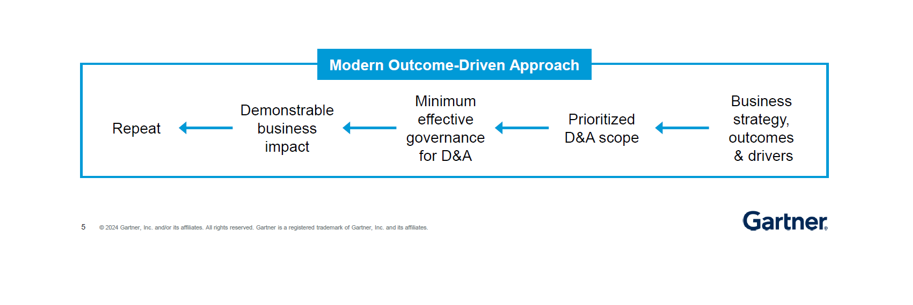
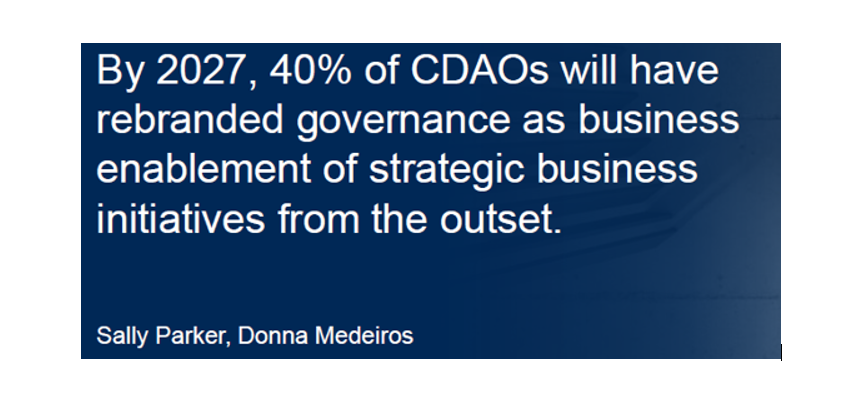
As final takeaway as shown in the previous paragraph, Governance was a central theme in many of the sessions I attended. The modern approach to governance emphasizes a federated or cooperative model rather than a traditional centralized one. This approach aligns more closely with our business strategy and desired outcomes, rather than focusing solely on the data itself.

Governance should be driven by the business strategy and desired outcomes. By focusing on what we aim to achieve as an organization, we can ensure that our governance efforts are relevant and impactful.

Author: Xavier GROSFILS, COO at AKABI

SHARE ON :


Related articles

May 28, 2024

Read in minutes

Enhancing Real-Time Data Processing with Databricks: Apache Kafka vs. Apache Pulsar

In the era of big data, real-time data processing is essential for organizations seeking immediate insights and the ability to respond swiftly to changing marke...

March 25, 2024

Read in minutes

Getting started with the new Power BI Visual Calculations feature!

Power BI’s latest feature release, Visual Calculations, represents a paradigm shift in how users interact with data.      Rolled ...

February 20, 2024

Read in 5 minutes

Revolutionizing Data Engineering: The Power of Databricks’ Delta Live Tables and Unity Catalog

Databricks has emerged as a pivotal platform in the data engineering landscape, offering a comprehensive suite of tools designed to tackle the complexities of d...


comments

Enhancing Real-Time Data Processing with Databricks: Apache Kafka vs. Apache Pulsar

May 28, 2024

Analytics Data Integration Microsoft Azure

Read in minutes

In the era of big data, real-time data processing is essential for organizations seeking immediate insights and the ability to respond swiftly to changing market conditions. Apache Kafka and Apache Pulsar are two of the most popular platforms for managing streaming data. Their integration with Databricks, a powerful analytics platform built on Apache Spark, enhances these capabilities, providing robust solutions for real-time data management. This article explores the features of Kafka and Pulsar, compares their strengths, and provides guidance on which to choose based on specific use cases.

Apache Kafka: A Standard in Data Streaming

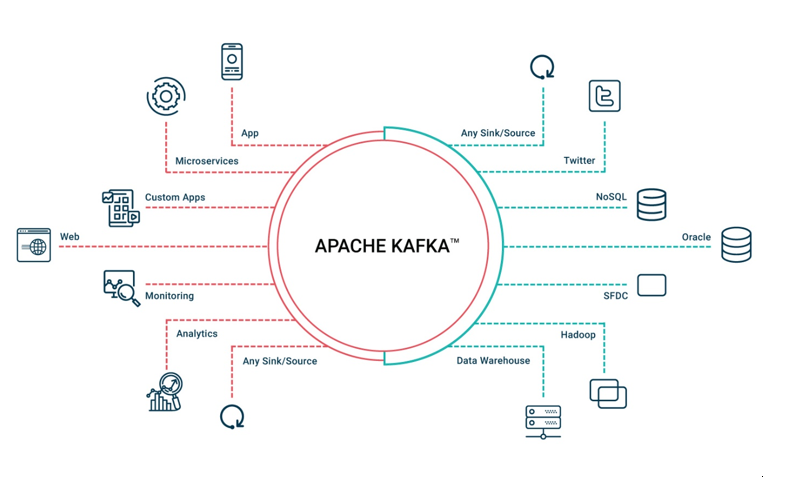
Apache Kafka is a distributed streaming platform originally developed by LinkedIn and later donated to the Apache Software Foundation. Kafka’s architecture is based on a distributed log, where data is written to “topics” divided into partitions.

Topics act as categories for data streams, while partitions are the individual logs that store records sequentially. This division allows Kafka to scale horizontally, enabling high throughput and parallel processing. Partitions also ensure fault tolerance by replicating data across multiple brokers, which maintains data integrity and availability.

Kafka excels in scenarios that require rapid ingestion and real-time processing of large volumes of data. Its ecosystem includes Kafka Streams for stream processing, Kafka Connect for integrating various data sources, and KSQL for querying data streams with SQL-like syntax. These features make Kafka ideal for applications such as monitoring, log aggregation, and real-time analytics.

Key Features of Kafka:

  • High Throughput and Low Latency: Capable of handling millions of messages per second with minimal delay, making it suitable for applications that require quick data processing.
  • Durable Storage: Messages can be stored for a configurable retention period, allowing for replay and historical analysis.
  • Mature Ecosystem: Includes robust tools for stream processing, data integration, and real-time querying.

Apache Pulsar: The Next Generation of Streaming

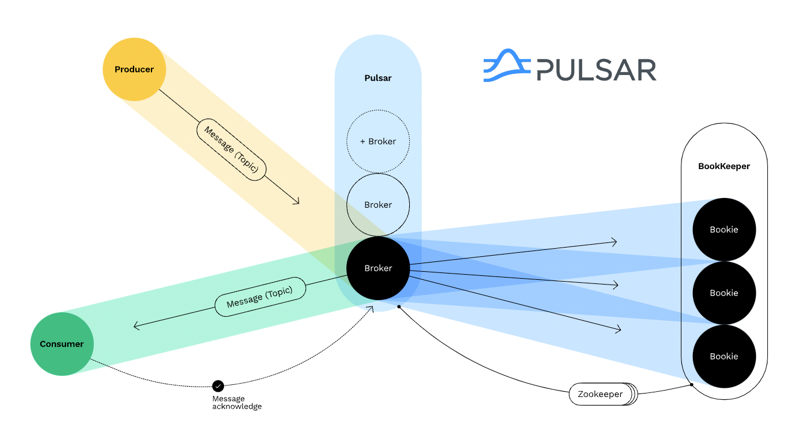
Apache Pulsar is a distributed messaging and streaming platform developed by Yahoo and now managed by the Apache Software Foundation. Pulsar’s architecture separates message delivery from storage using a two-tier system comprising Brokers and BookKeeper nodes. This design enhances flexibility and scalability.

Brokers handle the reception and delivery of messages, while BookKeeper nodes manage persistent storage. ZooKeeper plays a crucial role in this architecture by coordinating the metadata and configuration management. This separation allows Pulsar to scale storage independently from message handling, providing efficient resource management and improved fault tolerance. Brokers ensure smooth data flow, BookKeeper nodes ensure data durability, and ZooKeeper maintains system coordination and consistency.

Pulsar supports advanced features such as multi-tenancy, geographic replication, and transaction support. Its multi-tenant capabilities allow multiple teams to share the same infrastructure without interference, making Pulsar suitable for complex, large-scale applications. Additionally, Pulsar supports various APIs and protocols, facilitating seamless integration with different systems.

Key Features of Pulsar:

  • Multi-Tenancy: Supports multiple tenants with resource isolation and quotas, providing efficient resource management.
  • Advanced Features: Includes geographic replication for data availability across data centers and transaction support for consistent message delivery.
  • Flexible Integrations: Supports various APIs and protocols, enabling easy integration with different systems.

Comparing Apache Kafka and Apache Pulsar

While both Kafka and Pulsar are designed for real-time data streaming, they have distinct characteristics that may make one more suitable than the other depending on specific use cases.

Performance and Scalability: Kafka is known for its high throughput and low latency, making it ideal for applications requiring rapid data ingestion and processing. It is well-suited for high-performance use cases where low latency is critical. Pulsar, on the other hand, offers similar performance levels but excels in scenarios requiring multi-tenancy and seamless scaling. Its architecture separating compute and storage makes Pulsar preferable for applications needing flexible scaling and multi-tenant support.

Architecture and Flexibility: Kafka uses a simpler, monolithic architecture which can be easier to deploy and manage for straightforward use cases. This simplicity can be advantageous for quick and efficient setup. In contrast, Pulsar’s two-tier architecture provides more flexibility, especially for applications requiring geographic replication and fine-grained resource management. Pulsar is better suited for complex architectures needing advanced features.

Feature Set: Kafka’s extensive ecosystem, including tools like Kafka Streams, Kafka Connect, and KSQL, makes it a comprehensive solution for stream processing and real-time querying. This makes Kafka ideal for use cases that leverage its mature set of tools. Pulsar includes advanced features like native multi-tenancy, message replication across data centers, and built-in transaction support. These features make Pulsar preferable for applications requiring sophisticated capabilities.

Community and Ecosystem: Kafka has a larger and more mature ecosystem with widespread adoption across various industries, making it a safer bet for long-term projects needing extensive community support. Pulsar, while rapidly growing, offers cutting-edge features particularly appealing for cloud-native and multi-cloud environments. Pulsar is more appropriate for modern, cloud-native applications.

Integration with Databricks

Databricks, built on Apache Spark, leverages both Kafka and Pulsar to provide powerful and scalable real-time data processing capabilities. Here’s how these integrations enhance Databricks:

Databricks offers built-in connectors for reading and writing data directly from & to Kafka, enabling users to build real-time data pipelines using Spark Structured Streaming. This facilitates the transformation and analysis of data streams in real-time.

Similarly, Databricks supports Apache Pulsar, allowing for real-time data streaming with exactly-once processing semantics. Pulsar’s features such as geographic replication and transaction support enhance the resilience and reliability of streaming applications on Databricks.

Benefits of Integration

Integrating Kafka and Pulsar with Databricks provides several benefits. The scalability of both platforms allows for handling large volumes of real-time data without compromising performance. Pulsar’s multi-tenant capabilities and Kafka’s extensive features provide flexible integration tailored to specific business needs. Databricks also offers robust tools for access management and data governance, enhancing the security and reliability of streaming solutions.

Conclusion

Integrating Kafka and Pulsar with Databricks allows organizations to leverage leading streaming technologies to build efficient and scalable real-time data pipelines. By combining the power of Spark with Kafka’s resilience and Pulsar’s flexibility, Databricks provides a robust platform to meet the growing needs of real-time data processing.

For high-speed, low-latency applications, Kafka is the preferred choice. For complex, multi-tenant environments requiring advanced features like geographic replication and transaction support, Pulsar is more suitable.

Author: Pierre-Yves RICHER, Data Engineering Practice Leader at AKABI

SHARE ON :


Related articles

May 28, 2024

Read in minutes

Insights from the Gartner Data & Analytics Summit in London

I had the opportunity of attending the Gartner Data & Analytics Summit in London from May 13th to 15th. This three-day event featured over 100 sessions, man...

March 25, 2024

Read in minutes

Getting started with the new Power BI Visual Calculations feature!

Power BI’s latest feature release, Visual Calculations, represents a paradigm shift in how users interact with data.      Rolled ...

February 20, 2024

Read in 5 minutes

Revolutionizing Data Engineering: The Power of Databricks’ Delta Live Tables and Unity Catalog

Databricks has emerged as a pivotal platform in the data engineering landscape, offering a comprehensive suite of tools designed to tackle the complexities of d...


comments

Getting started with the new Power BI Visual Calculations feature!

March 25, 2024

Analytics Business Inteligence

Read in minutes

Power BI’s latest feature release, Visual Calculations, represents a paradigm shift in how users interact with data.     

Rolled out in February 2024 as a preview, this groundbreaking addition enables users to craft dynamic calculations directly within visuals. It opens up a new era of simplicity, flexibility and power in data analysis.

Visual Calculations are different from traditional calculation methods in Power BI. They are linked to specific visuals instead of being stored within the model. This simplifies the creation process and improves maintenance and performance. Visual Calculations allow users to generate complex calculations seamlessly, without the challenges of filter context and model intricacies.

This article explores Visual Calculations, including their types, applications, and transformative impact for Power BI users. Visual Calculations can revolutionize the data analysis landscape within Power BI by simplifying DAX complexities and enhancing data interaction.

Enable visual calculations

To enable this preview feature, navigate to Options and Settings > Options > Preview features and select Visual calculations.  After restarting the tool, Visual Calculations will be enabled.

Adding a visual calculation

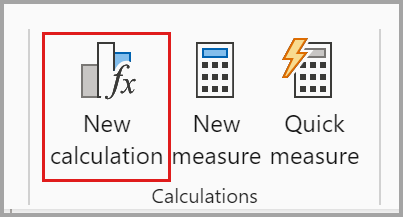
To add a visual calculation, select a visual and then select the New calculation button in the ribbon:

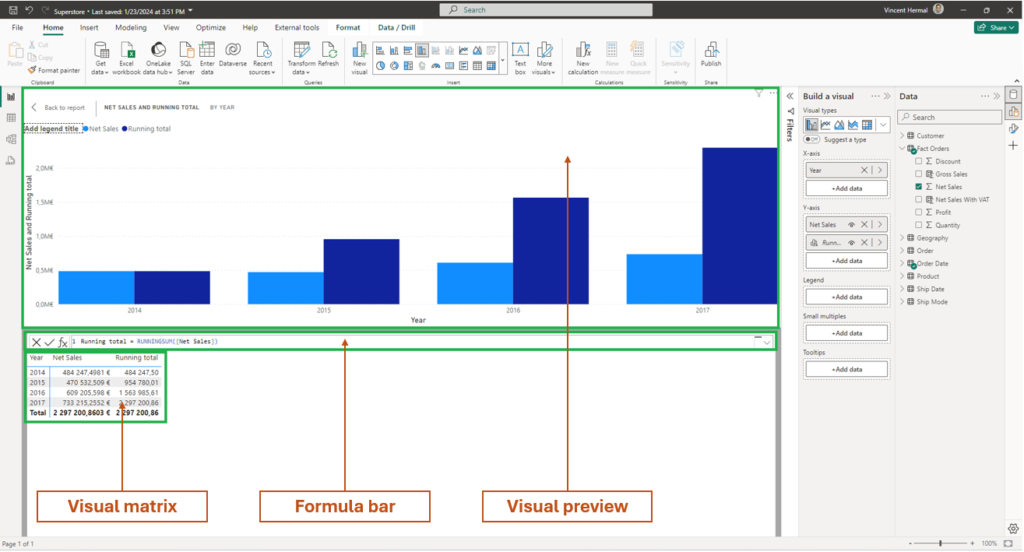
The visual calculations window becomes accessible when you enter Edit mode. Within the Edit mode interface, you’ll encounter three primary sections, arranged sequentially from top to bottom:

  • The visual preview which shows the visual you’re working with
  • A formula bar where you can define your visual calculation
  • The visual matrix which shows the data used for the visual, and displays the results of visual calculations as you add them

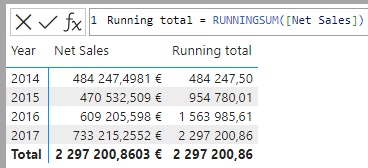
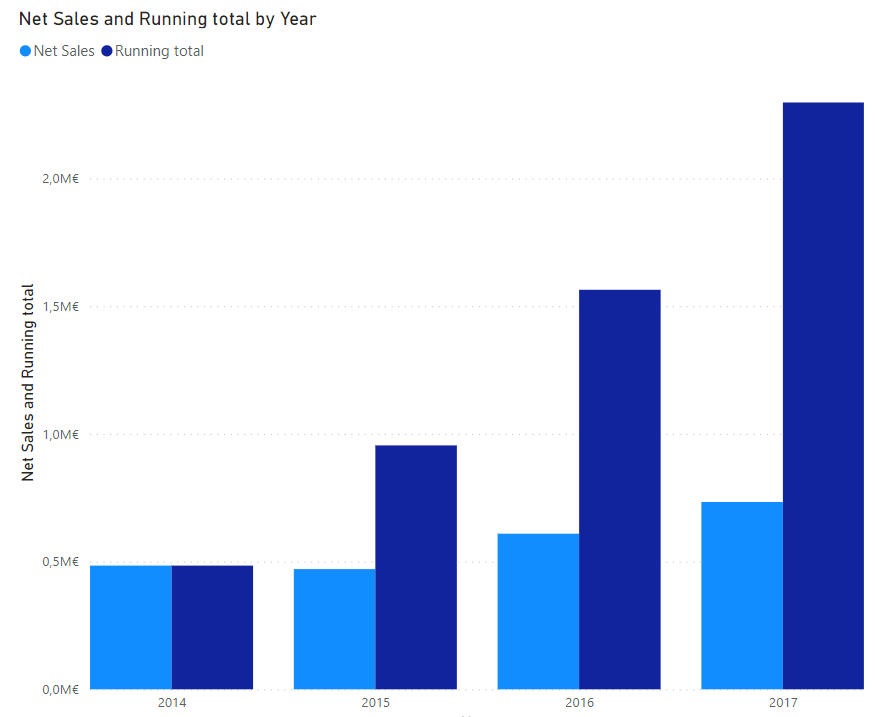
To create a visual calculation, simply input the expression into the formula bar. For instance, within a visual displaying Net Sales by Year, you can add a visual calculation to determine the running total by entering:

Running total = RUNNINGSUM([Net Sales])

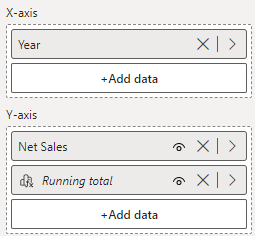
As you add visual calculations, they’re shown in the list of fields on the visual:

Additionally, the visual calculation is shown on the visual:

Without visual calculations, it’s a bit more complex: you must combine several DAX functions to get the same result. The DAX equivalent at model level would be the following formula:

Running total (model level) = 
VAR MaxDate = MAX('Order Date'[Date])
RETURN
    CALCULATE(
        SUM('Fact Orders'[Net Sales]),
        'Order Date'[Date] <= MaxDate,
        ALL('Order Date')
    )


Use fields for calculations without showing them in the visual

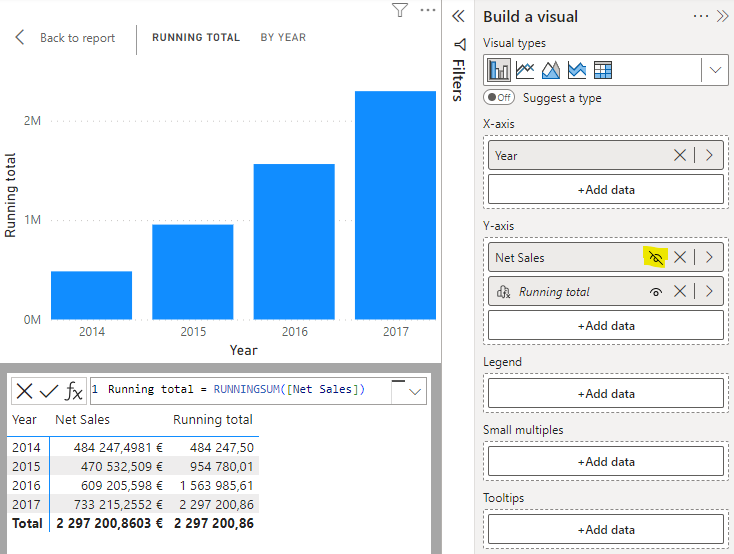
In Edit mode for visual calculations, you can hide fields from the visual. For example, if you want to show only the running total visual calculation, you can hide Net Sales from the view:

Hiding fields doesn’t remove them from the visual, so your visual calculations can still refer to them and continue to work. A hidden field will still appear in the visual matrix but will simply not appear in the resulting visual. It’s a very good idea from Microsoft, and a very practical one! As a good practice, we recommend to include hidden fields only if they are necessary for your visual calculations to work.

Templates available for common scenarios

To start with, several templates are already available, covering the most common scenarios:

  • Running sum: Calculates the sum of values, adding the current value to the preceding values. Uses the RUNNINGSUM function.
  • Moving average: Calculates an average of a set of values in a given window by dividing the sum of the values by the size of the window. Uses the MOVINGAVERAGE function.
  • Percent of parent: Calculates the percentage of a value relative to its parent. Uses the COLLAPSE function.
  • Percent of grand total: Calculates the percentage of a value relative to all values, using the COLLAPSEALL function.
  • Average of children: Calculates the average value of the set of child values. Uses the EXPAND function.
  • Versus previous: Compares a value to a preceding value, using the PREVIOUS function.
  • Versus next: Compares a value to a subsequent value, using the NEXT function.
  • Versus first: Compares a value to the first value, using the FIRST function.
  • Versus last: Compares a value to the last value, using the LAST function.

Conclusion

Visual Calculations bridge the gap between calculated columns and measures, offering the simplicity of context from calculated columns and the dynamic calculation flexibility of measures. Visual Calculations offer improved performance compared to detail-level measures when operating on aggregated data within visuals. They can refer directly to visual structure, providing users with unprecedented flexibility in data analysis.

This new feature will be very useful for those who are new to Power BI and for whom the DAX language can be a real challenge. It will simplify some calculation scenarios!

Author: Vincent HERMAL, Data Analytics Practice Leader at AKABI

SHARE ON :


Related articles

May 28, 2024

Read in minutes

Insights from the Gartner Data & Analytics Summit in London

I had the opportunity of attending the Gartner Data & Analytics Summit in London from May 13th to 15th. This three-day event featured over 100 sessions, man...

May 28, 2024

Read in minutes

Enhancing Real-Time Data Processing with Databricks: Apache Kafka vs. Apache Pulsar

In the era of big data, real-time data processing is essential for organizations seeking immediate insights and the ability to respond swiftly to changing marke...

February 20, 2024

Read in 5 minutes

Revolutionizing Data Engineering: The Power of Databricks’ Delta Live Tables and Unity Catalog

Databricks has emerged as a pivotal platform in the data engineering landscape, offering a comprehensive suite of tools designed to tackle the complexities of d...


comments

Coding Camp Python

March 25, 2024

Software Development

Read in 4 minutes

Continuous learning is part of AKABI’s DNA. Every year, all the collaborators have the opportunity to register for some training.

At the start of the year, I had the privilege of guiding my colleagues in the wonderful world of Python.

My challenge was the profile variety. From developers to data analysts. From Python beginner to veteran. But ultimately, Python’s versatility retains its greatest strength, and this training day was filled with exchanges of points of view.

The beginning of the journey

We began with an immersion into the fundamentals of the Python language, exploring its elegant and simple syntax. Then we explored the different data types and some of the greatest built-in tools provided by this language. We continued with some more advanced concepts like the generators and the decorators. The latter has attracted a lot of attention.

We also discussed several automated tools to improve the code quality and avoid issues due to the dynamic typing of Python. First, the duo iSort/Black reformat all the files with the same rules across the developers. Then the famous PyLint for static analysis. Of course, I had to talk about Ruff who does the same but much faster! The last tool presented was MyPy which, thanks to the annotations, allows us to have a type checking (I know it’s a bit against the DuckTyping but it can save your production environment).

We ended this introduction with an introspection exercise. A practical case where we must be able to retrieve a catalog of error classes to automatically generate documentation. This exercise has helped the consultant to understand the limitations of an interpreted language.

“Testing is doubting” but not for developers

After a short break, we dived into the fascinating world of testing. There, we were out of the comfort zone of the data analyst. We start with the well-known unit-test framework. It was brief since I don’t like its approach (more like Java than Python). Then I explain, in detail, the power of Pytest, its simple syntax and the flexibility provided by the fixtures.

Then I was able to share my enthusiasm about the Locust framework that I recently discovered. This tool is so great for perf-testing APIs. And best, we can write our scenario in Python.

Some web frameworks

After lunch and a small recap of the morning, I introduced some frameworks largely used to build APIs.

We start with the validation of user inputs with both Schemas and Pydantic.

With this new knowledge, we were able to discover Flask. The simplicity and easiness of implementing a web service have surprised our .Net developers.

In order to introduce the FastAPI framework, we talked about the GIL. The Global Interpreter Lock allows only one thread to execute code at a time, even on multi-core CPUs. This limits true parallelism. The discussion was mainly focused on how to deal with this limitation thanks to the asynchronous paradigm. We coded some examples of code with Asyncio to better understand this less-known paradigm. Thanks to these foundations, we were able to explore the main functions of FastAPI. Its elegant approach seduced some of the audience.

Data exploration

To end our journey, we explored the world of data analysis. We obviously discussed the famous Numpy and Pandas which are essential tools.

To improve the visualization of our analysis, we used the essential MatPlotLib. And for the first time, we leave the IDE for the data scientist IDE, aka Jupiter notebook.

After this busy day, we were able to discuss our different needs specific to our profiles. Some were even interested in a sequel in the form of a hackathon.

Testimonials

I am very happy to have attended this Python coding camp. I went there to expand my knowledge and refresh my Python skills a bit, but I found it very interesting.
The fact that we reviewed all the most commonly used Python libraries makes this training a real asset for my future projects.
If a Python project were ever to be proposed to me, I now have a better understanding to navigate towards one solution or another.
— Valentin Gesquiere

I had the opportunity to attend Simon’s Python course.
As a data engineer using data-oriented Python, I was looking forward to learning more about the language and its many uses.
After a quick refresher on the basics of the language, Simon went through the many uses of Python, including web frameworks, unit-test frameworks, libraries used in the data domain, and pre-commit tools to improve code quality.
It was really interesting to have an expert able to answer our many questions and show live examples.
I’ve come away from this course with lots of ideas for projects to try out.
— Pierre-Yves Richer

Author: Simon OLBREGTS, Software Craftmanship Practice Leader at AKABI

SHARE ON :


Related articles

July 1, 2024

Read in minutes

From Code Critic to Craftsman

My journey Throughout my IT career, a relentless pursuit of software quality has been my guiding principle. Early in my career design patterns, those reusable s...

September 16, 2022

Read in minutes

Blazor – Telerik UI Components

The Blazor framework by Microsoft allows you to create rich web UIs by using .NET and C#. The Telerik® UI for Blazor components facilitate the front-...


comments

Revolutionizing Data Engineering: The Power of Databricks’ Delta Live Tables and Unity Catalog

February 20, 2024

Business Inteligence Data Integration Microsoft Azure

Read in 5 minutes

Databricks has emerged as a pivotal platform in the data engineering landscape, offering a comprehensive suite of tools designed to tackle the complexities of data processing, analytics, and machine learning at scale. Among its innovative offerings, Delta Live Tables (DLT) and Unity Catalog stand out as transformative features that significantly enhance the efficiency and reliability of data pipelines. This article delves into these concepts, elucidating their functionalities, benefits, and their particular relevance to data engineers.

Delta Live Tables (DLT): Revolutionizing Data Pipelines

Delta Live Tables is an ETL framework built on top of Databricks, designed to streamline the development and maintenance of data pipelines. With DLT, data engineers can define declarative pipelines that automatically manage complex data transformations, dependencies, and error handling. This high-level abstraction allows engineers to focus on business logic and data transformations rather than the operational complexities of pipeline orchestration.


Key Features and Advantages:

  • Declarative Syntax: DLT allows data engineers to define transformations using SQL or Python, specifying what the data should look like rather than how to achieve it. This declarative approach simplifies pipeline development and maintenance.
  • Automated Error Handling: DLT provides robust error handling mechanisms, including automatic retries, dead-letter queues for unprocessable messages, and detailed error logging. This reduces the time data engineers spend on debugging and fixing pipeline issues.
  • Data Quality Controls: With DLT, data engineers can embed data quality checks directly into their pipelines, ensuring that data meets specified quality constraints before it moves downstream. This built-in validation mechanism enhances data reliability and trustworthiness.
  • Live Tables: DLT continuously monitors for new data and incrementally updates its outputs, ensuring that downstream users and applications always have access to fresh, high-quality data. This real-time processing capability is crucial for time-sensitive analytics and decision-making.
  • Change Data Capture (CDC): DLT supports the capture of changes made to source data, enabling seamless and efficient integration of updates into data pipelines. This feature ensures that data reflects the latest changes, crucial for accurate analytics and real-time reporting.
  • Historical and Live Views: Data engineers can create views that either maintain a history of data changes or display the most current data. This allows users to access data snapshots over time or see the present state of data, thereby facilitating thorough analysis and informed decision-making.

Unity Catalog: Centralizing Data Governance

Unity Catalog enhances Databricks by introducing a unified governance framework for all data and AI assets in the Lakehouse, centralizing metadata management, access control, and auditing to streamline data governance and security at scale.

A data catalog acts as an organized inventory for an organization’s data assets, providing metadata, usage, and source information to facilitate data discovery and management. Unity Catalog realizes this by integrating with the Databricks Lakehouse, offering not just a cataloging function but also a unified approach to governance. This ensures consistent security policies, simplifies data access management, and supports comprehensive auditing, helping organizations navigate their data landscape more efficiently and in compliance with regulatory requirements.

Key Features and Advantages:

  • Unified Metadata Management: Unity Catalog consolidates metadata across various data assets, including tables, files, and machine learning models, providing a single source of truth for data governance.
  • Fine-grained Access Control: With Unity Catalog, data engineers can define precise access controls at the column, row, and table levels, ensuring that sensitive data is adequately protected and compliance requirements are met.
  • Cross-Service Policy Enforcement: Unity Catalog applies consistent governance policies across different Databricks workspaces and services, ensuring uniform security and compliance posture across the data landscape.
  • Data Discovery and Lineage: It facilitates easy discovery of data assets and provides comprehensive lineage information, enabling data engineers to understand data origins, transformations, and dependencies. This transparency is vital for troubleshooting, impact analysis, and compliance auditing.
  • Auditing: This feature tracks data interactions, offering insights into user activities and changes within the Databricks environment. This facilitates compliance and security by providing a detailed audit trail for accountability and analysis.

Integration: Synergy Between DLT and Unity Catalog

The integration of Delta Live Tables and Unity Catalog within Databricks provides a cohesive and powerful environment for data engineering. DLT’s streamlined pipeline management, combined with Unity Catalog’s robust governance framework, offers a comprehensive solution for building, managing, and securing data pipelines at scale.

  • Enhanced Data Reliability: DLT’s real-time processing and data quality checks, coupled with Unity Catalog’s governance capabilities, ensure that data pipelines produce accurate, reliable, and compliant data outputs.
  • Increased Productivity: The declarative nature of DLT and the centralized governance of Unity Catalog reduce the complexity and overhead associated with data pipeline development and management, allowing data engineers to focus on delivering value.
  • Scalability and Flexibility: Both DLT and Unity Catalog are designed to scale with the needs of the business, accommodating large volumes of data and complex data transformations without sacrificing performance or manageability.

Conclusion: Empowering Data Engineers

For data engineers, the combination of Delta Live Tables and Unity Catalog within Databricks represents a significant leap forward in terms of productivity, data quality, and governance. By abstracting away the complexities of pipeline development and data management, these features allow engineers to concentrate on solving business problems through data. The result is a more efficient, reliable, and secure data infrastructure that can drive insights and innovation at scale. As the data landscape continues to evolve, tools like DLT and Unity Catalog will be indispensable in empowering data engineers to meet the challenges of tomorrow.

It’s important to note that, although Delta Live Tables (DLT) and Unity Catalog are designed to work together seamlessly within the Databricks environment, it’s perfectly viable to pair DLT with a different data cataloging system. This versatility allows organizations to take advantage of DLT’s sophisticated capabilities for automating and managing data pipelines while still utilizing another data catalog that may align more closely with their existing infrastructure or specific needs. Databricks supports this flexible data management strategy, enabling businesses to leverage DLT’s real-time processing and data quality enhancements without being restricted to using only Unity Catalog.

As we explore the horizon of technological innovation, it’s evident that the future is unfolding before us. Engaging with the latest advancements in data management and governance is more than just keeping pace; it’s about seizing the opportunity to redefine how we interact with the vast universe of data. The moment has come to embrace these new possibilities, leveraging their power to drive forward our data-centric initiatives.

Author: Pierre-Yves RICHER, Data Engineering Practice Leader at AKABI

SHARE ON :


Related articles

May 28, 2024

Read in minutes

Insights from the Gartner Data & Analytics Summit in London

I had the opportunity of attending the Gartner Data & Analytics Summit in London from May 13th to 15th. This three-day event featured over 100 sessions, man...

May 28, 2024

Read in minutes

Enhancing Real-Time Data Processing with Databricks: Apache Kafka vs. Apache Pulsar

In the era of big data, real-time data processing is essential for organizations seeking immediate insights and the ability to respond swiftly to changing marke...

March 25, 2024

Read in minutes

Getting started with the new Power BI Visual Calculations feature!

Power BI’s latest feature release, Visual Calculations, represents a paradigm shift in how users interact with data.      Rolled ...


comments

L’IA générative et les LLMs pour une information accessible et des processus optimisés

November 28, 2023

AI Event

Read in 10 minutes

Le mois dernier, Medhi Famibelle, Pascal Nguyen et moi avons assisté dans les locaux du Wagon (entreprise proposant des formations dans la data) à trois talks organisés dans le cadre d’un meet-up du groupe Generative AI Paris. Nous avons pu constater sans surprise la prévalence de l’IA et en particulier des technologies relevant des LLMs dans des secteurs très différents : elles permettent des optimisations et un gain de temps significatif lorsque maitrisée. Retrouvez l’intégralité des présentations ici :

Meetup “Generative AI Paris” – 31 Octobre 2023 – YouTube

Petit tour d’horizon des talks.

  • Utilisation et optimisation de la méthode RAG 🤖

Le Retrievial Augmented Generation (RAG) est devenu la technique phare en NLP pour construire des systèmes de Question & Answering permettant d’interroger en langage naturel des données de formats et sources divers. Chez Sicara, le RAG a été implémenté via un chatbot Slack permettant de répondre à des questions sur l’entreprise. Le RAG passe par le chunking des documents afin de les vectoriser et les disposer dans une base de données pour pouvoir évaluer la similarité avec une question posée.

Quelle différence entre un POC et un programme en prod ? Pour un POC, utiliser un framework tel que Langchain pour manipuler le LLM est une bonne idée. Il faut ensuite choisir la base de données : vectorielle ou non. Il nous recommande l’utilisation de bases de données non vectorielles telles que Postgres/Elasticsearch lorsque le nombre de vecteurs attendus est sous le million. Dans le cas inverse, il existe des bases vectorielles dédiées telles que ChromaDB ou Qdrant.

Rien ne vaut le contrôle sur le modèle afin notamment de pouvoir affiner ses prédictions en analysant les probabilités en sortie. C’est un avantage des LLM open sources selon l’intervenant. Toutefois, en fonction du volume de la base de connaissances, une solution payante passant par exemple par GPT peut être plus économe et efficace. Pour passer de POC à production, réfléchir à la mise à jour des vecteurs de la base, en cas d’ajouts ou de modifications des documents, est très important. Cela peut être fait via des workflows avec, par exemple Airflow. Collecter et analyser les entrées des utilisateurs permet aussi de savoir si l’outil est bien utilisé, de s’assurer que les utilisateurs ne sont pas démunis face à lui. Utiliser DVC peut être utile pour expérimenter avec différents modèles. Vous l’avez compris : tester, monitorer pour améliorer les résultats du RAG est la bonne démarche.

  • L’IA générative au service des jeux vidéo 🎮

Vous connaissez peut-être l’univers des jeux mobiles. Chez Popscreen, le développement de jeux vidéo a été considérablement accéléré grâce à l’IA générative pour faire du contrôle créatif : générer des images et du texte.

La génération des images passe par SD1.5, Stable Diffusion et des modèles Lora. Ils utilisent aussi ControlNet pour générer des images à partir des dessins de leurs artistes : en s’appuyant sur une image de référence (utilisée pour la texture), un personnage (dessiné par leurs artistes), ils sont capables de générer différentes unités générées en quelques jours grâce à Stable Diffusion. À partir d’une vingtaine d’illustrations faites par leurs artistes, Popscreen peut obtenir un modèle lora qui, couplé à SD1.5, leur permet de créer de toutes nouvelles unités à partir de prompt.

Côté génération de texte, on retrouve GPT et Langchain. Ces outils permettent à l’entreprise de générer différents éléments textuels : dialogues, descriptions des classes de personnages, etc. Grâce à l’IA générative, l’entreprise estime réaliser en quelques semaines des contenus qui leur prendraient plusieurs mois à être faits de façon traditionnelle.

  • L’IA générative au service de la pédagogie 📚

Le dernier speaker de Didask, nous montre comment les LLM ont permis à son entreprise de création d’e-learning d’économiser 12 000 jours de travail. Ils se sont appuyés sur la connaissance métier d’experts en sciences cognitives et de l’éducation pour savoir comment structurer l’information afin d’avoir une approche « learner first » de l’apprentissage pour les apprenants d’un module d’e-learning.

Cela passe par l’identification de l’enjeu cognitif principal des notions que l’e-learning doit transmettre à l’apprenant. Déconstruire les schémas erronés ? Mise en situation de l’apprenant. Créer des traces mentales pour mémoriser de nombreuses informations ? Utilisation de flashcards.

L’IA pédagogique sélectionne le format approprié pour le contenu qui doit être transmis en fonction de l’enjeu cognitif, génère le contenu puis transforme le contenu en une expérience interactive. Tout ceci est fait à partir de documents non structurés en entrée de l’IA pédagogique. Cette IA fonctionne notamment grâce au LLM et notamment le RAG afin de décider des objectifs pédagogiques, du contenu par format (flashcards, mise en situation, etc.). Tout ceci est rendu possible grâce à un prompt engineering adéquat, s’appuyant sur l’expertise des experts en sciences cognitives et de l’éducation, que le LLM utilise en arrière-plan. 🧠

Nous constatons que l’intelligence artificielle générative « autrefois » connue uniquement pour la génération d’images connait une progression fulgurante en traitement automatique du langage et est de plus en plus utilisée avec des résultats plus que prometteurs. Heureusement, chez AKABI, nous restons à l’affut des progrès dans ce domaine pour pouvoir répondre aux enjeux business et aux nouveaux use cases naissant chaque jour. 🚀

Nicolas Baouaya, IA & Data Science Consultant

SHARE ON :


Related articles

May 28, 2024

Read in minutes

Insights from the Gartner Data & Analytics Summit in London

I had the opportunity of attending the Gartner Data & Analytics Summit in London from May 13th to 15th. This three-day event featured over 100 sessions, man...

November 20, 2023

Read in 5 minutes

AKABI’s Consultants Share Insights from Dataminds Connect 2023

Dataminds Connect 2023, a two-day event taking place in the charming city of Mechelen, Belgium, has proven to be a cornerstone in the world of IT and Microsoft ...

March 17, 2019

Read in 2 minutes

Human and Machine Learning

I had the opportunity to attend the 2019 Gartner Data & Analytics Summit at London. Here is a wrap up of some notes I took during the sessions. Few years ag...