
Welcome to the second part of our Dataminds Connect 2024 recap! After covering the first two days of this event in our initial article, we’re excited to share our feedback from the final day of the conference. This concluding day proved especially valuable, with in-depth sessions on Microsoft Fabric, Power BI, and Azure cloud solutions, providing practical perspectives for our ongoing and future projects. Join us as we explore the key highlights, lessons learned, and impactful discussions from the last Dataminds Connect.
The Power of Paginated Reports – Nico Jacobs
As we all know, paginated reports are the evolution of a very old technology: SSRS (for SQL Server Reporting Services). But that doesn’t mean it should be considered legacy! This option still has a lot to offer, and Mr. Jacobs illustrates this beautifully with five fundamental advantages such as export options, component nesting, source flexibility, etc.
Disaster Recovery Strategies for SQL Server – Andrew Pruski
“A pessimist is an optimist with experience”, “Hope is not a strategy” (by Google SRE Team Motto), “Business don’t care about SQL Server or Oracle, They care about data” – these are just a few of the key phrases that raise awareness of the importance of a contingency plan in the event of a technical problem. Solutions and safeguards are then proposed to prevent the main bad practices. The most important thing to remember is that you shouldn’t worry about whether your database is backed up, but about how and how quickly the backup can be restored and made operational.
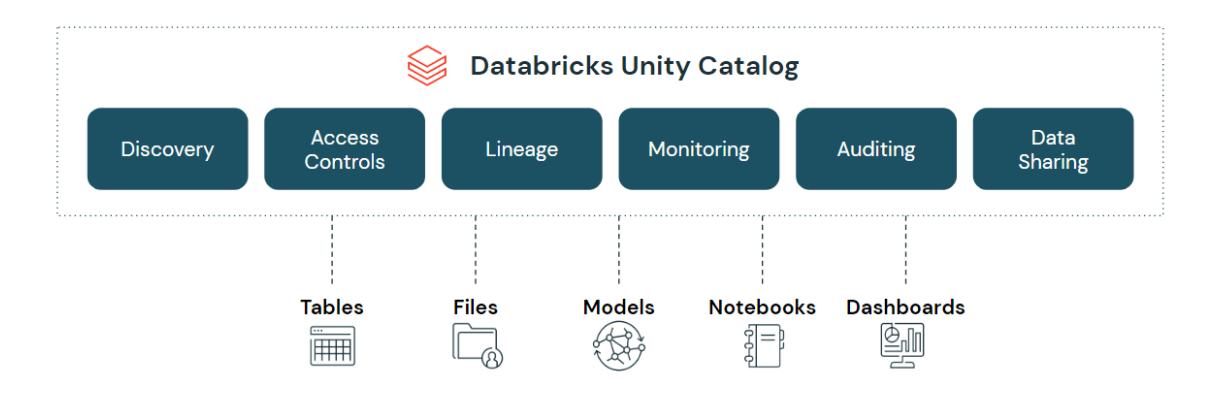
The Renaissance of Microsoft Pureview – Tom Bouten
“If DATA is the new OIL, then METADATA will make you RICH” is the tagline for any data lineage tool. This is how Mr. Bouten introduces the Pureview tool. The tool wasn’t great when it first came out, but it’s getting better all the time. It’s worth keeping an eye on it because it’s automating more and more processes and discoveries. It’ll be used in more and more functions within a company. Thanks for the presentation and the refresher.
Start 2 MLOps: From the lab to production – Nick Verhelst
In this MLOps session, we have explored the machine learning lifecycle process, emphasizing essential aspects like clear problem definitions, stakeholder alignment, and the importance of monitoring and quality assurance. These are foundational to ensuring successful outcomes in machine learning projects.
Also, we have discussed around the double diamond design process illuminated its role in business and data understanding, showing how alternating between problem definition and solution exploration helps guide the ML lifecycle
The session gave me a comprehensive overview of the ML project lifecycle, stressing the importance of structure, collaboration, and the right tools. By balancing creative exploration with robust coding practices and incorporating monitoring tools
With great power comes a great bill: optimize, govern and monitor your Azure costs – Kristijan Shirgoski
“It is never too late to start”, In this session we have discussed several tips, recommendations and how bill works for resources that are very commonly used such as Data Factory, Databricks, SQL Databases, Synapse, Fabric, Log Analytics, Data Lake, Virtual Machines, etc.
So, we have learned the newest best practices to save costs in our cloud infrastructure discussing subjects like azure policies, DBU (Databricks Unit), DSU (Databricks Storage Unit), tags, scale up on demand, share compute, auto termination, spot instances, reservations, quotas, infrastructure as code to optimize and monitor our azure costs.
“Today is the first day until the rest of your life”, from this session I keep in mind the relevance of monitor our resources and activity in Cloud to improve performance and save costs through good practices
Optimize your Azure Data & AI platform for peak performance: rethink security and stability – Wout Cardoen
In the session I learned that modularity is crucial for staying ahead of the competition. This involves ensuring that specific data is handled appropriately, building a future-oriented data platform, and accelerating development processes.
Security was highlighted with the principle “trust is good; control is better”. Key elements include managing identity and data access with a least-privileged approach, integrating secret management with Azure Key Vault, implementing network security through total lockdown, and adopting the four-eyes principle in DevOps security. Data quality was emphasized through the application of metadata constraints
Finally, I was reminded to maintain order and cleanliness on the platform. Avoid temporary solutions or remove them promptly and ensure proper documentation. The importance of not overengineering the platform with unnecessary functionalities was also stressed, promoting efficiency and focusing on essential features.
Power BI refreshes – reinvented! – Marc Lelijveld
This session explored the various refresh options available in Power BI, highlighting their advantages and the contexts in which they are best utilized. We examined different storage modes—Import, Direct Query, and Dual Mode—demonstrating how they can be combined in a composite model. We also discussed the importance of incremental refresh, including when and how to implement it effectively. Finally, we covered how to connect Power BI refreshes to other processes for centralized orchestration. Overall, this session provided valuable insights into optimizing data refresh strategies in Power BI.
What Fabric means for your Power BI semantic models – Kurt Buhler
I was thoroughly impressed by the session delivered by Kurt. His presentations always stand out with incredibly well-designed slides that have a unique and captivating visual style. The various scenarios he presented were especially interesting, as they allowed us to grasp each concept in-depth and explore possible solutions.
Kurt explained how Microsoft Fabric introduces new features that will transform the way we build and use Power BI semantic models. He highlighted the importance of understanding these features and knowing how and when to apply them effectively. The session covered what a Power BI semantic model is, why it’s essential in Fabric, and explored three scenarios showing how teams are leveraging these features to address current Power BI challenges.
In this talk, Kurt assumed a foundational understanding of features like Direct Lake storage mode, semantic link in notebooks, and Git integration. He focused more on the ‘how’ and “why” of these tools, which added a layer of strategic thinking beyond just knowing what they do.
By the end of the session, I had a much clearer understanding of how I might approach these new features for the semantic models. It was an incredibly valuable and engaging presentation!
The sidekick’s guide to supercharging Power BI Heroes – Paulina Jędrzejewska
I really loved the presentation given by Paulina. She started by sharing her professional background and explained how her first mission at a client allowed her to quickly find a way to make a difference using Power BI. This set the stage for what was to come—a highly engaging and technical demo.
The demo focused on Tabular Editor, showcasing the power of C# scripting and Calculation Groups, which was incredibly insightful. The idea was to demonstrate how Tabular Editor can save significant time in creating generic measures, adding descriptions, and more. Paulina walked us through how to automate and optimize processes, streamlining the development of efficient data models.
In conclusion
To wrap up, our experience at the seminar was truly enriching across all sessions. The diversity of topics and expertise has left us well-equipped with new ideas and strategies to apply in our work. A special thanks to all the organizers and speakers for making this event so impactful. The lessons learned will play a crucial role in driving our continued success. We look forward to attending future editions and further contributing to the growing knowledge within our industry!
See you next time!
Authors: Alexe Deverdenne, Sophie Opsommer, Hugo Henris, Martin Izquierdo, Pierre-Yves Richer, Thibaut De Carvalho