
I had the opportunity of attending the Gartner Data & Analytics Summit in London from May 13th to 15th. This three-day event featured over 100 sessions, many of which ran concurrently, making it impossible to capture everything. However, I would like to share my top takeaways from this insightful conference.
D&A generate value
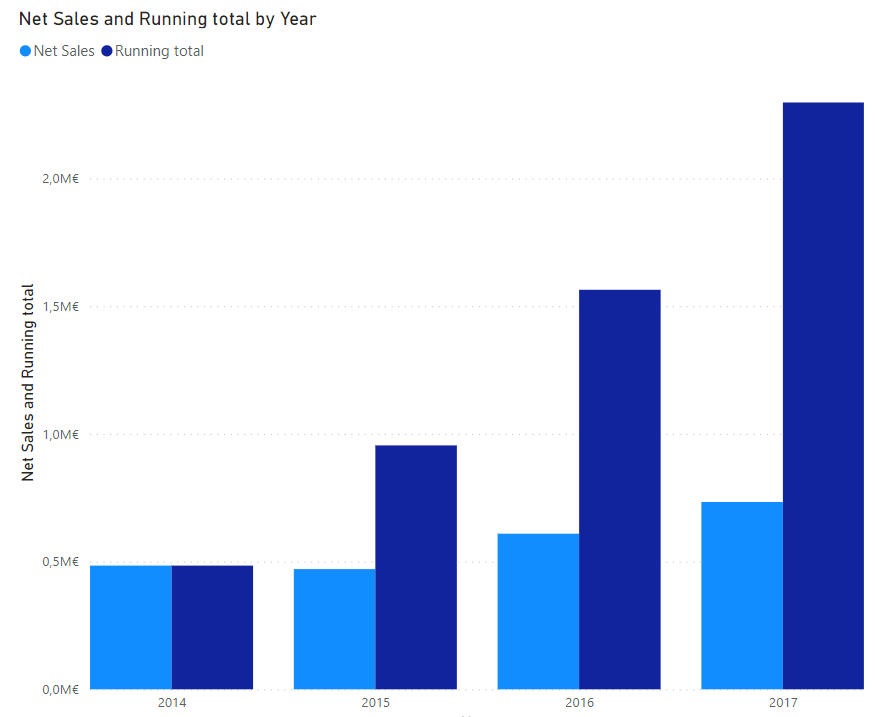
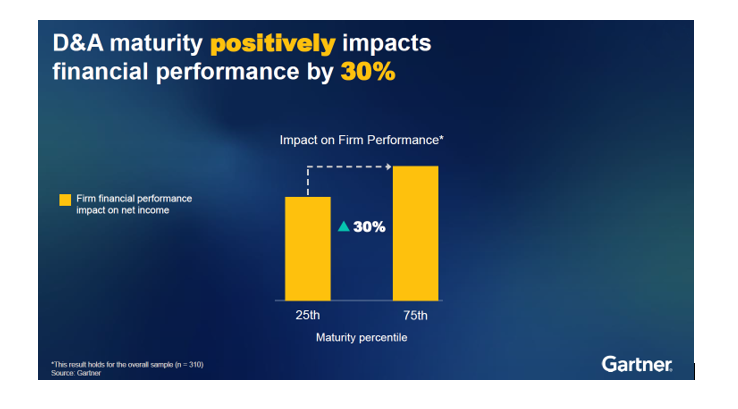
It’s usually very difficult to evaluate the return of the governance and management of the D&A. Gartner made a lot of studies and polls to bring some concrete evidence.
Studies show a good D&A maturity impact positively the financial performance of firms by 30%.
Governance is a keystone of D&A maturity, but its return is highly under valuated.
Firms should focus on business outcomes rather than ROI and prioritize Execution over strategy.
Evaluating the return on governance and management of Data & Analytics (D&A) is often challenging. Recent studies and polls conducted by Gartner provide some evidence to help our efforts.
A a strong D&A maturity can boost a firm’s financial performance by 30%.
Governance is a critical cornerstone of this D&A maturity, yet its value is frequently underestimated. To harness the full potential of our D&A initiatives, it’s essential that we shift our focus from traditional ROI metrics to broader business outcomes.
Moreover, prioritizing execution over strategy can drive more tangible results. By emphasizing practical implementation and operational excellence, we can ensure that our D&A governance delivers maximum value to the organization.
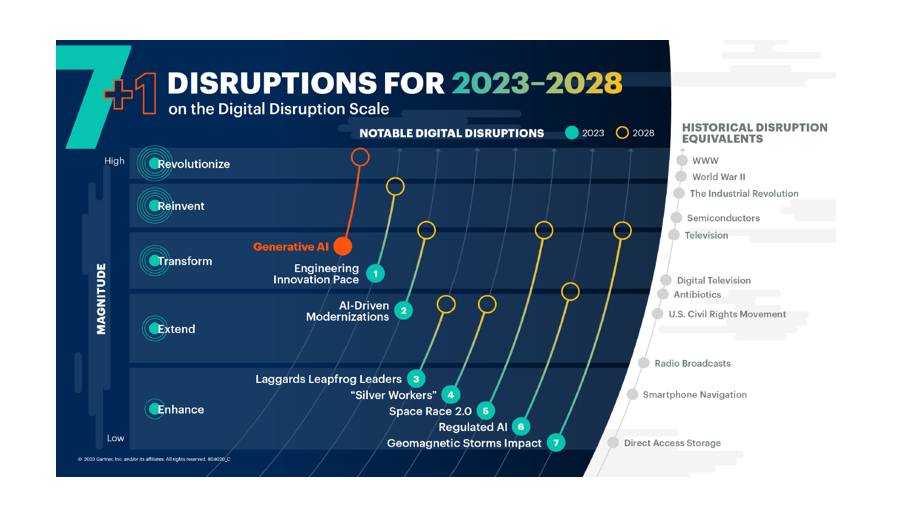
AI and GenAI – the elephant in the room
Everyone is talking about AI and GenAI, and it’s widely accepted that GenAI represents a disruption on par with the creation of the internet itself. The pressing question is: how can we harness this disruption to meet our own needs?
Studies show that firms which have designated AI as a strategic priority have outperformed their peers by 80% over the past nine years. This highlights the transformative potential of AI when integrated into a company’s core strategy.
I could hear on many sessions the “AI-ready Data” concept. Mainly compared with Analytics data, above quality, compliance, and accessibility, AI require more metadata, context, labeling. This can only be achieved through mature governance practices.
Learning & collective intelligence
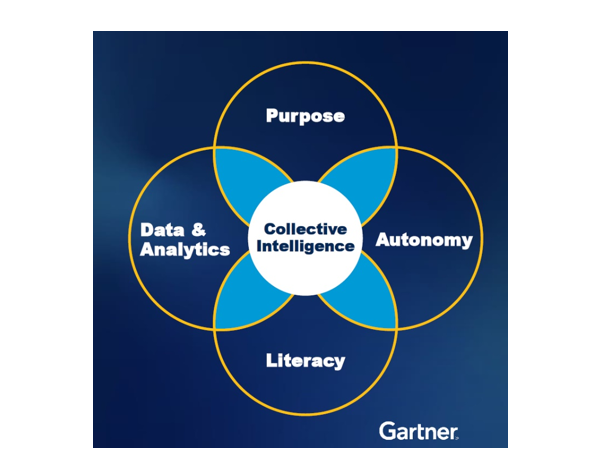
In today’s fast-paced and data-rich environment, strong centralized models struggle to keep up with the volume of data and the speed at which decisions need to be made. The concept of collective intelligence: distributing decision-making power to local groups rather than centralizing it with top management.
This approach can be effectively implemented by focusing on several key areas:
Access to the Right Data: Ensure that all team members have access to the relevant and necessary data. This empowers local groups to make informed decisions quickly and accurately.
Sense of Purpose: Clearly communicate the organization’s vision and goals. When teams understand the bigger picture and their role within it, they are more motivated and aligned with the company’s objectives.
Autonomy: Granting teams the autonomy to make decisions fosters innovation and responsiveness. Local groups are often closer to the issues at hand and can act more swiftly than a centralized authority.
Literacy: Invest in training programs that enhance data and AI literacy skills. Equipping teams with the knowledge to understand and leverage data effectively is crucial for informed decision-making.
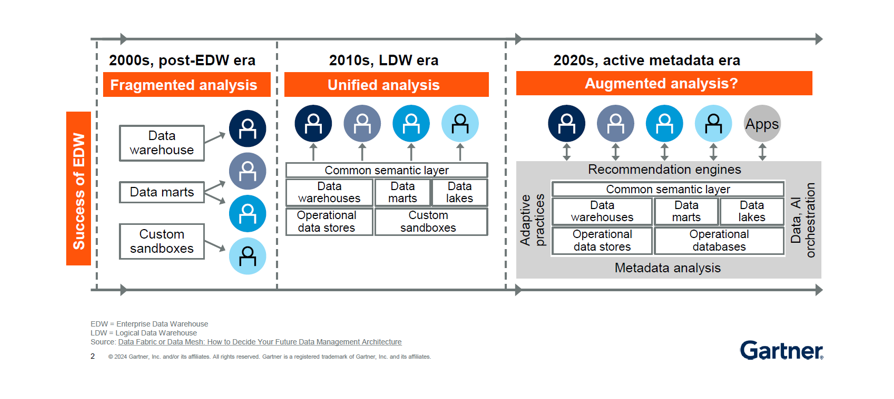
Data Fabric and Data Mesh
During the summit, two key architectural approaches were frequently discussed: Data Fabric and Data Mesh. While sometimes viewed as opposing strategies, they can also be seen as complementary.
Data Fabric focuses on leveraging the extended metadata provided by our existing platforms. Its primary goal is to “activate” this metadata to facilitate automated enhancements and suggestions.
Data Mesh, on the other hand, decentralizes data delivery and empowers business-driven D&A initiatives. Its core principles include treating Data as a Product.
Combining these approaches can lead to a scalable, flexible data architecture.
Data Fabric’s automation capabilities can enhance the efficiency of decentralized data management within a Data Mesh framework.
The extended metadata in Data Fabric can support the productization efforts of Data Mesh, ensuring that data products are enriched with comprehensive metadata.
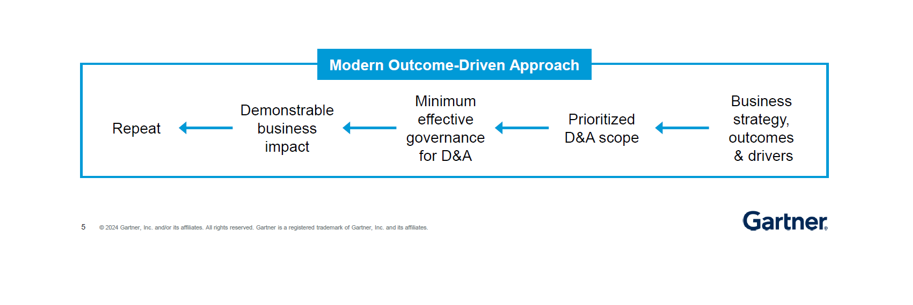
Data and Analytics Governance Is Key to Your Success
As final takeaway as shown in the previous paragraph, Governance was a central theme in many of the sessions I attended. The modern approach to governance emphasizes a federated or cooperative model rather than a traditional centralized one. This approach aligns more closely with our business strategy and desired outcomes, rather than focusing solely on the data itself.
Governance should be driven by the business strategy and desired outcomes. By focusing on what we aim to achieve as an organization, we can ensure that our governance efforts are relevant and impactful.
Author: Xavier GROSFILS, COO at AKABI